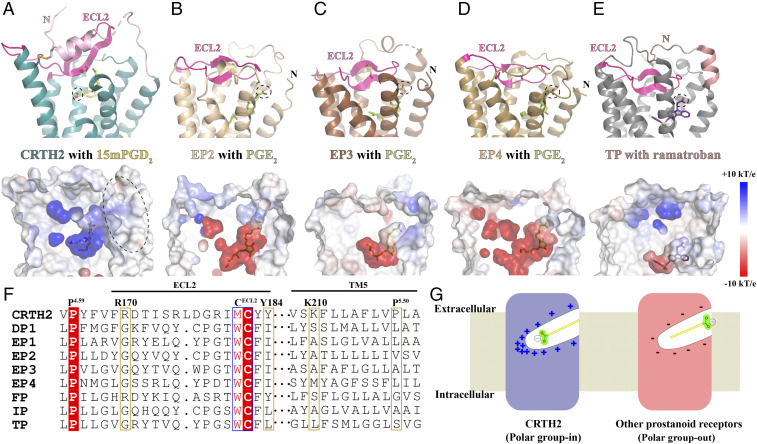
Fig. 2.
Structural comparison analysis. (A) CRTH2 with 15mPGD2. The N-terminal region preceding TM1 is colored in light pink. (B–D) EP2, EP3, and EP4 with PGE2 (Protein Data Bank [PDB] IDs: 7CX2, 6AK3, and 7D7M, respectively). (E) TP with ramatroban (PDB ID: 6IIU). The N-terminal region preceding TM1 is colored in salmon. ECL2 in each receptor is colored in magenta. 15mPGD2, PGE2, and ramatroban are colored in yellow, green, and purple, respectively. The carboxyl group in each ligand is circled. The charge distributions of ligand-binding pockets of these prostanoid receptors are shown in the lower panels. (F) Sequence alignment of all prostanoid receptors. The alignment of ECL2 sequences was based on the alignments of two highly conserved residues, P4.50 and the cysteine residue, in ECL2, forming the conserved extracellular disulfide bond. The alignment of TM5 sequences was based on the alignment of 5.50 residues in the receptors. (G) Two lipid-binding modes.

