Fig. 5.
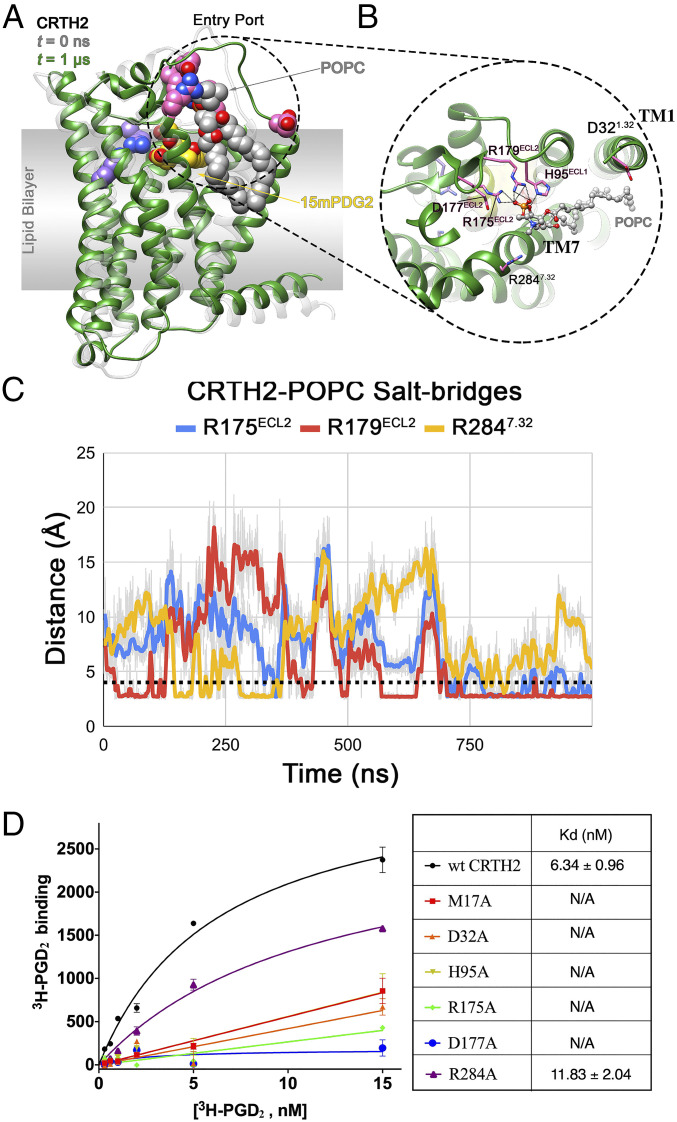
CRTH2–POPC interaction in holo-1 simulation and mutagenesis data. (A) Interaction of a bilayer POPC molecule, with the residues lining the entry port in holo-1 simulation. The structures of the receptor at t = 0 ns (translucent gray) and t = 1 μs (green) are shown in ribbon representation. The entry port residues (pink), bound 15mPGD2 (yellow), POPC (gray), and binding site residues R170ECL2 and K2105.42 (purple) are shown in sphere representation. (B) Close up of the CRTH2 entry port–POPC interaction, with the bound POPC (gray) and entry port residues (pink) shown in ball-and-stick and stick representation, respectively. The interactions between the POPC and the protein residues are shown as black dotted lines. (C) Evolution of CRTH2–POPC intermolecular salt bridges during the 1-µs holo-1 simulation, with the dotted black line indicating the cutoff distance of 4.0 Å. (D) Saturation-binding assays on different CRTH2 constructs using 3H-PGD2. All CRTH2 constructs were transiently expressed in human embryonic kidney 293 cells, and cell membranes were prepared and used in the ligand-binding assays. Expression of each construct was confirmed by cell surface staining. Nonspecific binding measured in the presence of access amount of PGD2 was subtracted. The dissociation equilibrium constants (Kds) of PGD2 for the wtCRTH2 and the R284A mutant are listed in the table shown on the right of panel D. For other CRTH2 mutants, no saturable 3H-PGD2 binding was observed, indicating mostly nonspecific binding. Each data point in the left panel is shown as mean ± SEM and n = 3.

