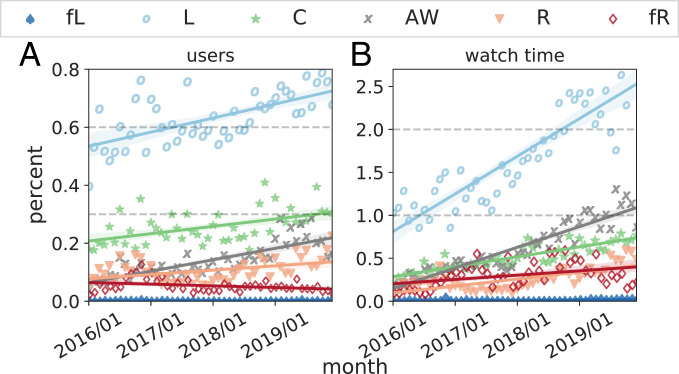
Fig. 2.
Breakdown of percent of (A) users and (B) consumption falling into the six political channel categories, per month, January 2016 to December 2019. A is the percent of users falling into each community, and B presents the percentage of viewership duration from each channel category. Solid lines show the fitted linear models and the shading shows the 95% confidence intervals.

