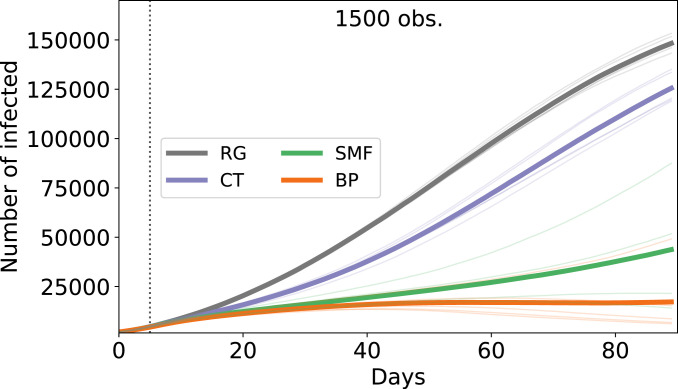
Fig. 1.
SIR model on proximity-based random network with six contacts on average per day and individuals. The epidemic parameters are the same as those used by the inference algorithms: . In the plot, we show the average numbers (bold lines) of infected individuals vs. time among three different realizations (thin lines) of the epidemics with 200 patients zero. The system freely evolves for the first 10 d, and then, interventions start. We consider of the infected individuals each day as severely symptomatic. These individuals are observed as infected 5 d after their infection. Then, 1,500 tests are performed daily according to the ranking given by the algorithms. The observed infected individuals are quarantined. The parameters used for these simulations are for both SMF and CT and for SMF. obs., observations.

