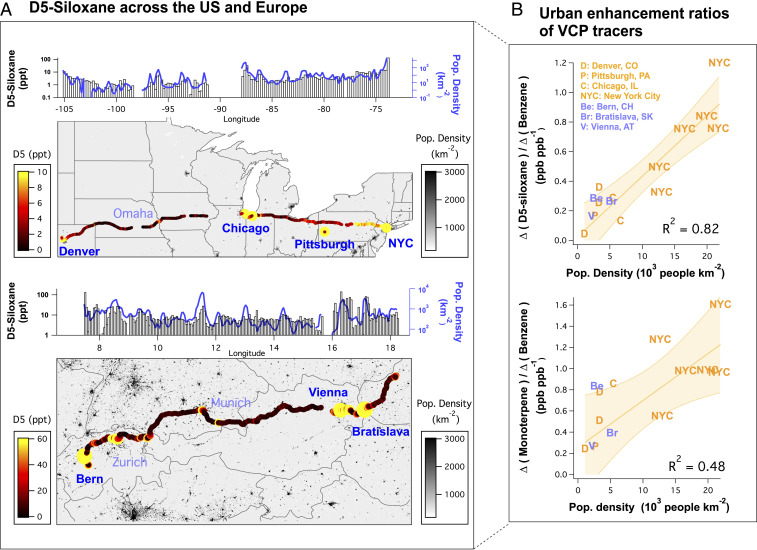
Fig. 1.
(A) Drive track colored and sized by D5-siloxane measured across the United States and parts of Europe. The distributions above each map show the median mixing ratios of D5-siloxane over longitudinal bins together with the population density within 5 km of the mobile laboratory. (B) Relationship between D5-siloxane and monoterpene ERs to benzene (gasoline tracer), with population density for US (orange) and European (blue) cities. The cities presented were sampled during morning hours in densely populated urban centers. For NYC, the data were separated into areas of high, low, and medium population density (see Materials and Methods). Error bands represent the 95% CI.

