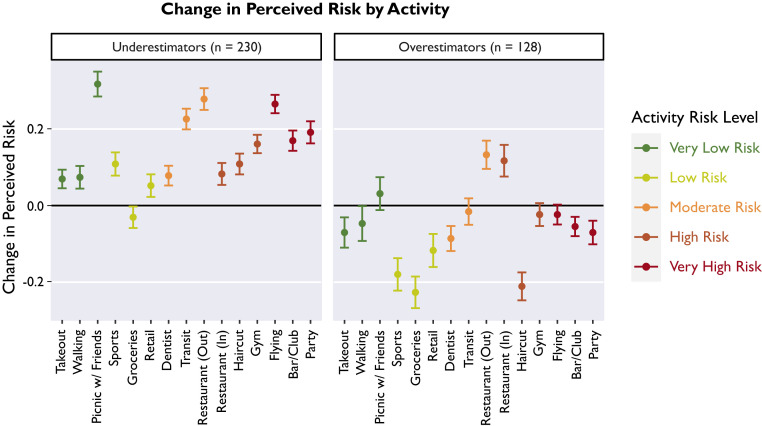
Fig. 3.
Change in perceived risk by activity. Points depict the average within-subjects change in perceived risk for each of the 15 everyday activities assessed. Activities are color coded according to approximate risk level (89). Participants who had been underestimating risk (average prediction error ≥15) reported increases in perceived risk (Left), whereas participants who had been overestimating risk (average prediction error ≤ −15) reported decreases in perceived risk (Right). Error bars indicate 95% confidence intervals around the mean. Black line indicates zero, no change from the preintervention baseline.

