Figure 1.
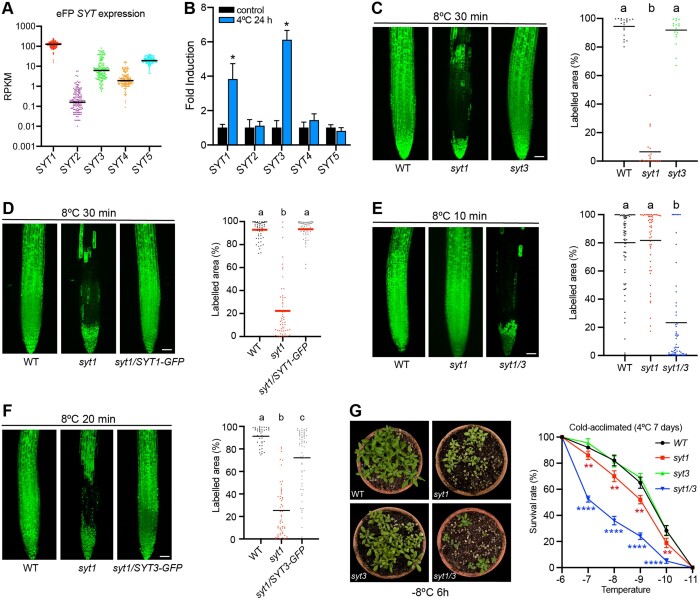
SYT1 and SYT3 are important for PM stability under abiotic stress. A, RNAseq data of SYT1, SYT2, SYT3, SYT4, and SYT5 obtained from vegetative tissues at different developmental stages from eFP-seq Browser (https://bar.utoronto.ca/eFP-Seq_Browser/). Each dot represents a value of RPKM and the bar represent the median. B, SYT1 and SYT3 transcripts are induced by cold. Arabidopsis WT seedlings were grown under long-day photoperiod and 23°C for 7 d and then transferred to 4°C for 24 h or kept under control conditions. The relative expression level of the SYT genes was measured by RT-qPRC and normalized to the expression of ACTIN2. Columns are showing mean values of fold induction; error bars indicate sd (n = 3 pools of 20 seedlings per experiment). C–F, Confocal images and cell viability quantification after cold treatment in 6-d-old Arabidopsis roots. Seedlings grown in half-strength MS agar solidified medium under long-day photoperiod and 23°C. Cell viability was determined by FDA staining and quantified as the percentage of root area with fluorescence above an automatic threshold stablished by the “Moments” algorithm of Fiji (see “Methods” for details). Each dot represents a measurement of an individual root. Horizontal lines represent mean values. C, Increased sensitivity of syt1 compared to WT and syt3 roots. D, The cell viability of syt1 roots is complemented by a SYT1-GFP fusion protein driven by the SYT1 promoter. E, syt1/3 double mutant shows decreased cell viability compared to the single syt1 mutant. F, Cell viability of syt1 roots is complemented by a SYT3-GFP fusion protein driven by the 35S promoter. Significant different values are indicated by letters (P < 0.001; one-wayANOVA uncorrected Fisher’sLSD). Scale bars 50 µm. G, Three-week-old WT, syt1, syt3, and syt1/3 Arabidopsis plants were grown under long-day photoperiod at 20°C and then cold-acclimated for 7 d at 4°C. After that, plants were exposed to different freezing temperatures for 6 h and freezing tolerance was estimated as the percentage of plants surviving each specific temperature after 7 d of recovery under control conditions. Asterisks indicate statistical differences between mutant versus WT determined for each freezing temperature by one-way ANOVA and Tukey’s multiple comparison test. Data represent mean values, error bars are sd, n ≥ 30 plants per genotype for each freezing temperature.

