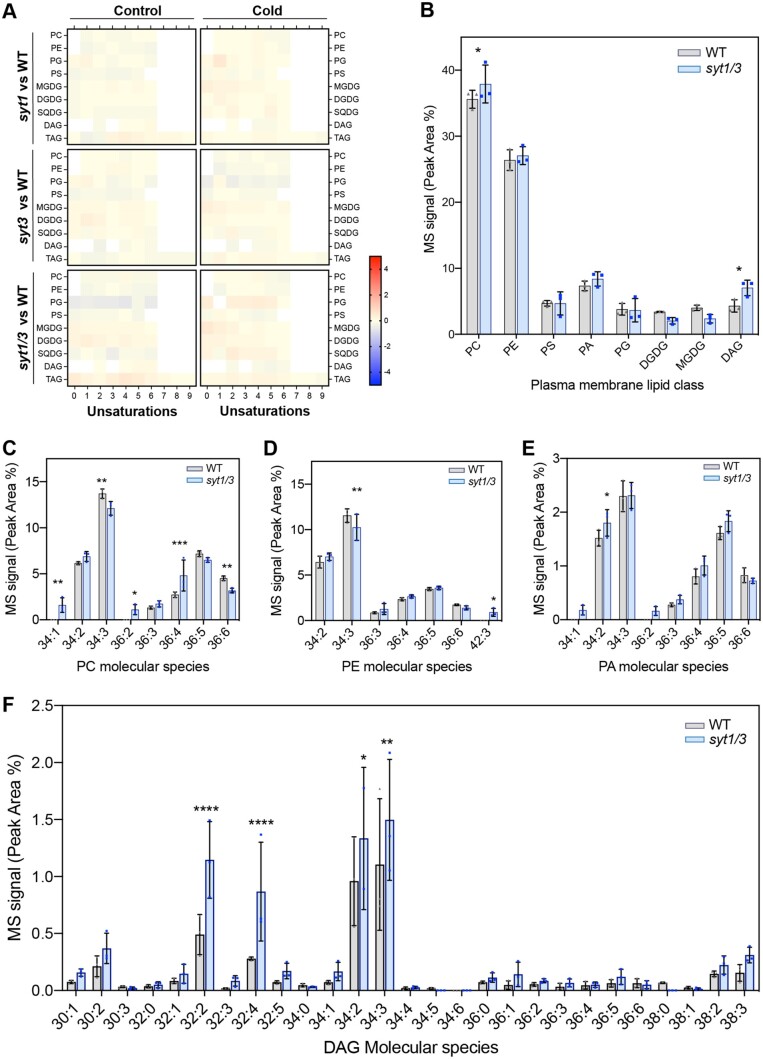
Figure 5.
SYT1 and SYT3 maintain DAG homeostasis at the PM. A, Heatmap panels representing the fold change in the peak area of each glycerolipid class and unsaturation grade of the acyl chains when comparing WT against syt1, syt3, or syt1/3. Four-week-old rosettes were analyzed after growing under control conditions and after a 7 d cold treatment (4°C). See also Supplemental Figure S5A. Color scale code expresses mean fold changes of the corresponding glycerolipids (n = 3 pools of five independently grown plants). B, ESI–MS/MS analysis of the molecular species of PM glycerolipids from 4-week-old WT and syt1/3 rosettes grown at 23°C followed by 3 d of cold treatment (4°C). PM samples were purified by two phase partitioning protocol and lipids were extracted following as described in “Methods.” Column bars represent mean values of three biological replicates (pools of >50 plants) and error bars are showing SD. See also Supplemental Figure S5B. C–F, Distribution of the identified PC (C), PE (D), PA (E), and DAG (F) molecular species in PM of WT and syt1/3. Acyl chains are expressed as number of acyl carbons: number of acyl double bonds. Data of lipids in PM are represented as column bars (mean values of three biological replicates; pools of >50 plants) and error bars are showing sd. B–F, Asterisks indicate statistically significant differences between PM in WT and syt1/3 plants as determined by the Fisher LSD test; ****P < 0,0001; ***P < 0,0002; **P < 0,0021; *P < 0,0332.

