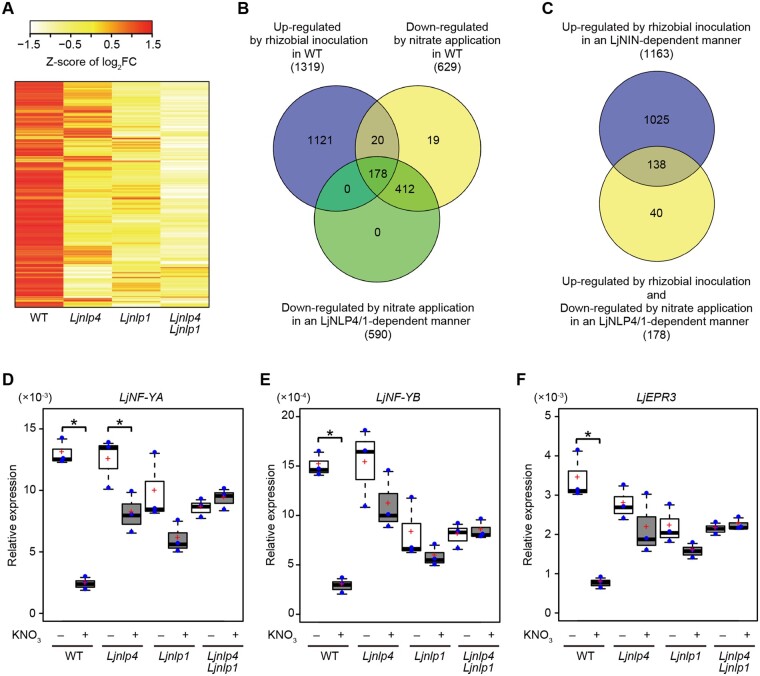
Figure 4.
Transcriptome analysis of the Ljnlp4 and the Ljnlp1 mutants during root nodule symbiosis. A–F, WT, the Ljnlp4-1 mutants, the Ljnlp1 mutants, and the Ljnlp4-1 Ljnlp1 double mutants were grown without nitrate nor rhizobia for 4 d and then treated with 0 or 10 mM KNO3 for 24 h before rhizobia inoculation with continuous treatment of 0 or 10 mM KNO3. WT and the Ljnin-9 mutants were grown at inoculated and noninoculated conditions without nitrate. RNA was extracted for (A–C) RNA-seq and (D–F) real-time RT-PCR analysis from inoculated roots (3 dai) or noninoculated roots (n = 3 independent pools of roots derived from 10 plants). A, A heatmap showing relative transcript abundance (10 mM KNO3/0 mM KNO3) for nitrate-inducible genes (364 genes) in WT, the Ljnlp4-1 mutants, the Ljnlp1 mutants, and the Ljnlp4-1 Ljnlp1 double mutants. Nitrate-inducible genes were identified in WT by gene expression levels with at least a 2-fold change (log2 fold changes (log2FC) >1 and FDR <0.05) when grown in 10 mM KNO3 compared with those grown in 0 mM KNO3 (Supplemental Data Set S1A). B, A Venn diagram showing the number of rhizobia-inducible genes in WT (1,319 genes), nitrate-repressible genes in WT (629 genes), and LjNLP4/1-regulated nitrate-repressible genes (590 genes). Genes upregulated between inoculated and noninoculated roots were extracted based on select criteria (log2FC >1 and FDR <0.05). Downregulated genes between 10 and 0 mM KNO3-treated roots were extracted based on similar criteria (log2FC < −1 and FDR < 0.05) (Supplemental Data Set S2, A, B, and E). C, A Venn diagram showing the overlap between LjNIN-dependent rhizobia-inducible genes (1,163 genes) and rhizobia-inducible and LjNLP4/1-dependent nitrate-repressible genes (178 genes) (Supplemental Data Set S2E, S3A and S3D). D–F, Real-time RT-PCR analysis of (D) LjNF-YA, (E) LjNF-YB, and (F) LjEPR3 expression in WT, the Ljnlp4-1 mutants, the Ljnlp1 mutants, and the Ljnlp4-1 Ljnlp1 double mutants. The expression of LjUBQ was used as the reference. Centerlines in the boxplots show the medians, and upper and lower quartile limits are shown as horizontal bars. Individual data points are represented by blue points, and red crosses indicate the sample means. *P < 0.05 by a two-sided Welch’s t test.

