Figure 1.
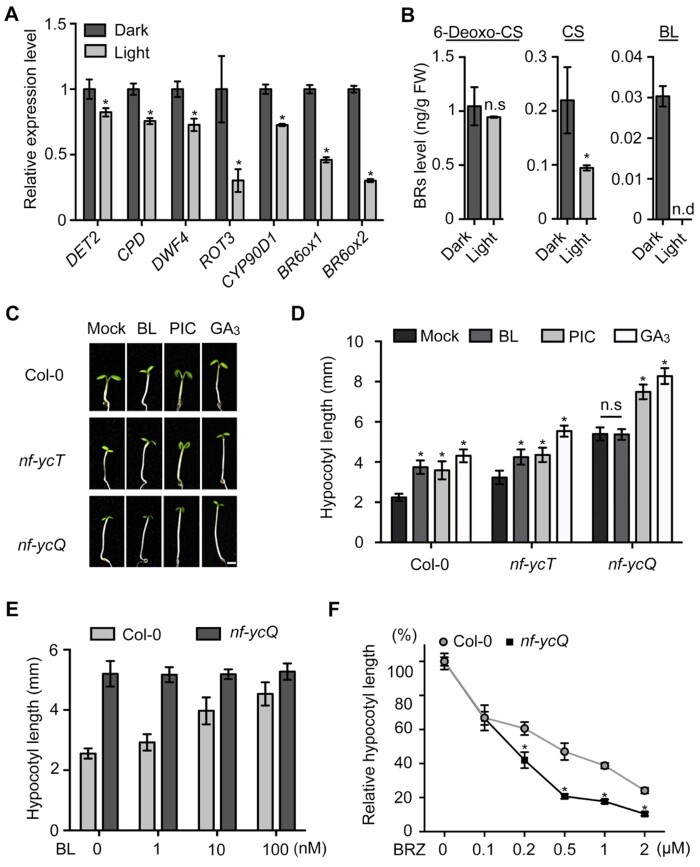
NF-YCs are involved in BR-mediated hypocotyl growth in the light. A, RT-qPCR analysis of BR biosynthesis gene expression in Col-0 seedlings grown in the light or dark for 3 d. Relative gene expression was calculated by comparing the value with that of seedlings grown in the dark. Data represent mean ± sd of three biological replicates. PP2A was amplified as an internal control. B, Endogenous BR levels of Col-0 seedlings grown in the light or dark for 3 d. Data represent mean ± sd of two biological replicates. Asterisks in (A) and (B) indicate significant differences between dark and light conditions (P < 0.01, Student’s t test). NS indicates no significant difference. ND indicates no detection. C, Hypocotyl phenotypes of Col-0, nf-ycT, and nf-ycQ grown in the light with BL (20 nM), PIC (10 µM), and GA3 (10 µM) treatment for 5 d. Scale bar, 1 mm. D, Hypocotyl lengths of the seedlings shown in (C). Data represent means ± sd of at least 20 seedlings with three biological replicates. Asterisks indicate significant differences in seedlings treated with BL, PIC, and GA3 compared with the mock (P < 0.01, Student’s t test). E, Hypocotyl length of Col-0 and nf-ycQ seedlings treated with different concentrations of BL in the light for 5 d. Data represent means ± sd of at least 20 seedlings with three biological replicates. F, Relative hypocotyl length of Col-0 and nf-ycQ seedlings treated with different concentrations of BRZ in the light for 5 d. Relative hypocotyl length was calculated by comparing the value of BRZ treatment with that of the mock. Data represent means ± sd of at least 20 seedlings with three biological replicates. Asterisks indicate significant differences between Col-0 and nf-ycQ (P < 0.01, Student’s t test).

