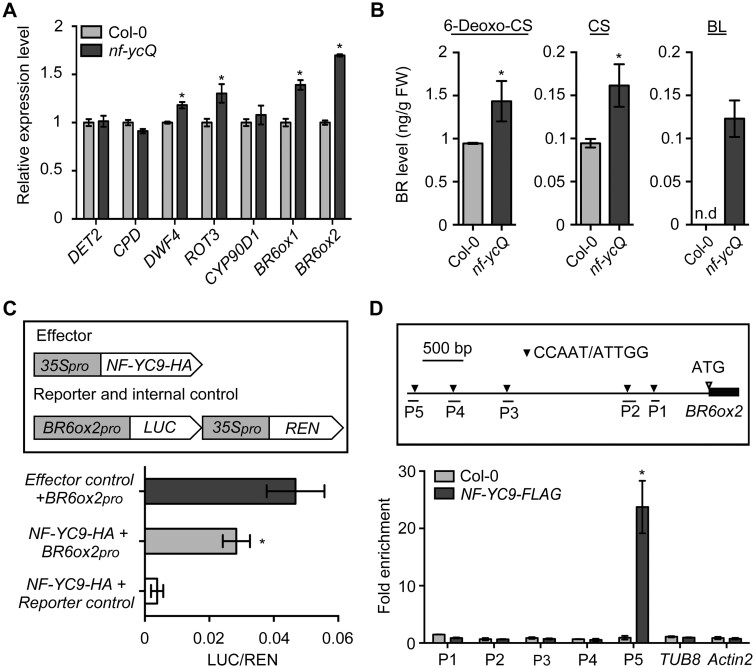
Figure 2.
NF-YCs directly target the BR6ox2 promoter to inhibit BR biosynthesis. A, RT-qPCR analysis of BR biosynthesis gene expression in Col-0 and nf-ycQ seedlings grown in the light for 3 d. Relative gene expression was calculated by comparing the value with that of Col-0. Data represent mean ± sd of three biological replicates. Asterisks indicate significant differences from Col-0 (P < 0.01, Student’s t test). PP2A was amplified as an internal control. B, Endogenous BR levels of Col-0 and nf-ycQ seedlings grown in the light for 3 d. Data represent mean ± sd of two biological replicates. Asterisks indicate significant differences between Col-0 and nf-ycQ seedlings in the light (P < 0.01, Student’s t test). Note: the BR contents in Figures 1, B and 2, B were measured together and thus the light-grown Col control is same in these two figures. C, Transient expression assay indicating that the expression of BR6ox2 is repressed by NF-YC9. Upper part shows a schematic diagram of the effector and reporter constructs used in the transient expression assay. Lower part shows the results of the transient expression assay. Either the reporter (BR6ox2pro) or the relevant empty vector (reporter control) was co-transformed with the effector and the relevant empty vector (effector control) into Arabidopsis mesophyll protoplasts. Asterisks indicate significant difference compared with the Effector control+BR6ox2pro (P < 0.01, Student’s t test). D, ChIP analysis of NF-YC9 binding to the BR6ox2 promoter regions. Upper part shows the 3.3-kb promoter regions of BR6ox2. Lower part shows that NF-YC9-FLAG was enriched in the P5 region of the BR6ox2 promoter. The nf-yc9-1 NF-YC9pro:NF-YC9-3FLAG (NF-YC9-FLAG) and Col-0 seedlings were grown in the light for 3 d and harvested for ChIP-qPCR analysis. Data represent mean ± sd of three biological replicates. Asterisks indicate significant differences in fold enrichment between NF-YC9-FLAG and Col-0 (P < 0.01, Student’s t test).

