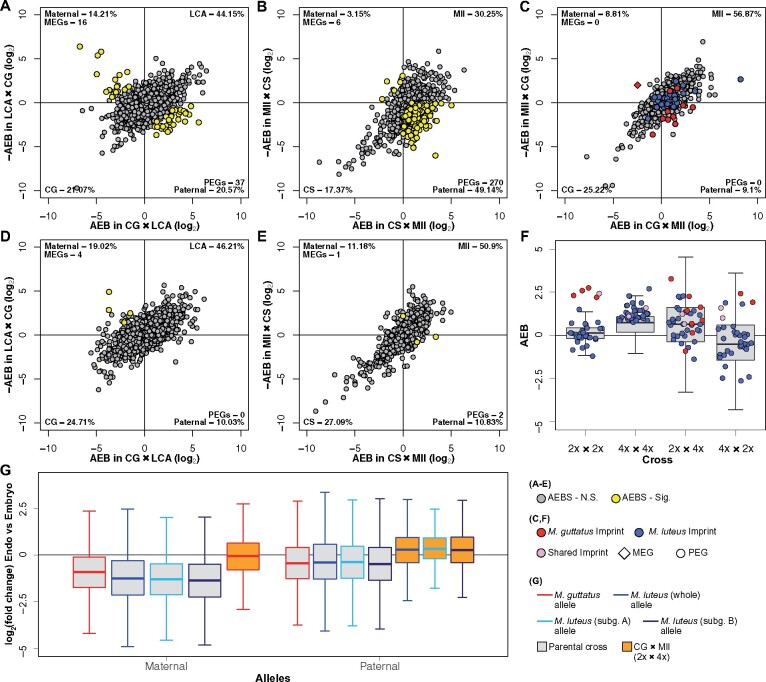
Figure 4.
Patterns of imprinting and parental bias. A–E, Distributions of AEB in the endosperm and embryo of M. guttatus (A and D, respectively) and M. luteus (B and E), and the endosperm of the hybrids (C). Genes in scatterplots are plotted by their AEB value in one cross on the x-axis against –AEB of the reciprocal cross on the y-axis. Due to the reciprocal crossing design, bias is divided into four quadrants. Points that fall into the bottom left or top right quadrants represent line or species-specific bias, points in the bottom right have paternal bias, and points in the top left have maternal bias. The percentage of genes in each of these quadrants is given in the corner of that quadrant. The number of PEGs and MEGs is also listed in their respective quadrants. A comparison between hybrid embryos is not included since there was insufficient tissue for Mll × CG (4x × 2x) embryo. Yellow points signify imprinted genes, as determined by a likelihood ratio test (LRT). M. luteus and M. guttatus PEGs identified within the hybrid endosperm (C) are highlighted in blue and red, respectively. The single MEG from M. guttatus is represented by a red diamond. Note these are not significantly imprinted in hybrid endosperm according to LRTs. F, AEB of M. guttatus (red) and M. luteus (blue) PEGs found in each cross, plotted onto the entire AEB distribution of that cross (shown as boxplots). AEB values of genes are averaged between reciprocal crosses for both M. guttatus (2x × 2x) and M. luteus (4x × 4x). G, Log2 fold-change of gene expression (measured in RPKM) between endosperm and embryo (positive values indicate greater endosperm expression) plotted for each allele (maternal and paternal) from M. guttatus, M. luteus, and CG × Mll (2x × 4x) crosses. RPKMs were averaged between reciprocal crosses for each tissue for both M. guttatus and M. luteus. Gray boxes indicate parental crosses (M. guttatus and M. luteus) and orange boxes indicate 2x × 4x. Red lines indicate the M. guttatus genome, and blue indicates the M. luteus genome, whether in parental crosses or inherited in 2x × 4x. The M. luteus genome is also separated into its two subgenomes: A (light blue lines) and B (navy lines). Outliers were removed for F and G

