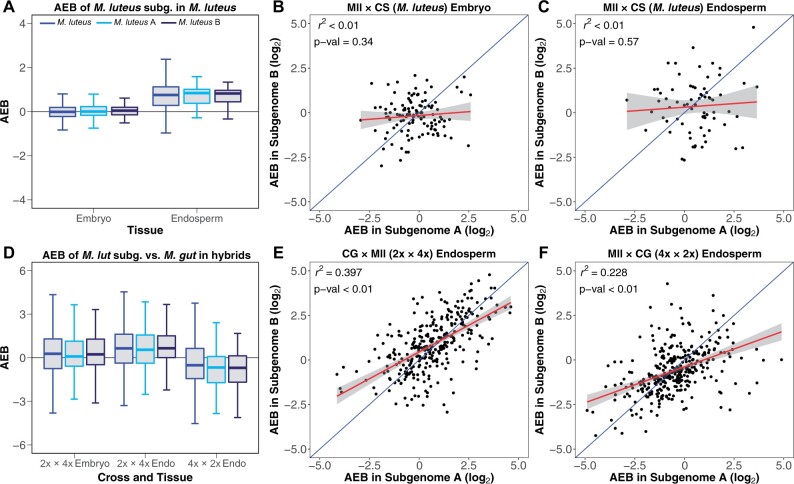
Figure 5.
Comparison of AEB values between M. luteus subgenomes. AEB distribution of each of the two subgenomes from M. luteus (A, light blue and B, navy) in parental M. luteus (A) and reciprocal hybrid crosses (2x × 4x [CG × Mll] and 4x × 2x [Mll × CG] in D) for endosperm and embryo (other than 4x × 2x). AEB of reciprocal crosses for M. luteus are averaged. Linear regressions were performed comparing AEB values for genes on M. luteus subgenome A to AEB values of their respective homeologs on subgenome B for M. luteus (values for Mll × CS are shown here) embryo (B) and endosperm (C), and for the endosperm of 2x × 4x (E) and 4x × 2x (F). R2 values and P-values for linear regressions are provided in the top left corner of each plot. A hypothetical 1:1 relationship is shown in blue with the actual linear model in red. The gray shaded area represents the 95% confidence interval of the linear model.

