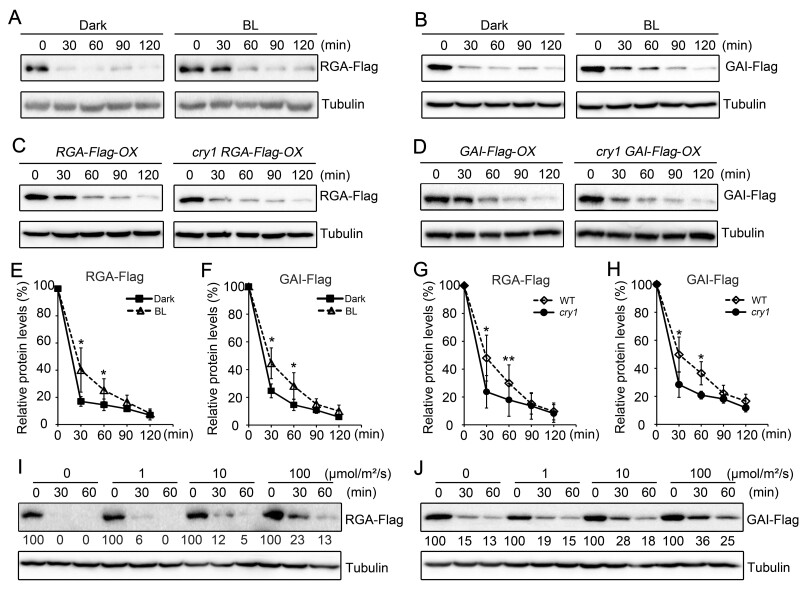
Figure 1.
CRY1 mediates the blue light inhibition of GA-induced degradation of DELLA proteins. A, B, Blue light inhibits GA-induced degradation of RGA-Flag (A) and GAI-Flag (B) proteins, as shown by immunoblot analysis. RGA-Flag-OX and GAI-Flag-OX seedlings (WT background) were grown on MS medium containing 1-μM PAC in the dark for 5 days, and were then treated with 100-μM GA3 + 1-μM PAC and exposed to blue light (BL, 30 μmol·m–2·s–1) or maintained in the dark for the indicated time. Three independent experiments were performed, and one is shown. C, D, CRY1 mediates the blue light inhibition of GA-induced degradation of RGA-Flag (C) and GAI-Flag (D) proteins, as shown by immunoblot analysis. RGA-Flag-OX and GAI-Flag-OX seedlings (WT and cry1 backgrounds) were grown on MS medium containing 1-μM PAC in the dark for 5 days, and were then treated with 100-μM GA3 + 1-μM PAC and exposed to blue light (30 μmol·m–2·s–1) for the indicated time. Three independent experiments were performed, and one is shown. E–H, Relative protein levels of GA-induced degradation of RGA-Flag and GAI-Flag shown in (A–D) as means ± standard deviation (sd; n = 3; Student’s t test, **P < 0.01, *P < 0.05). I, J, Effects of blue light intensity on GA-induced degradation of RGA-Flag (I) and GAI-Flag (J) proteins, as determined by immunoblot analysis. RGA-Flag-OX and GAI-Flag-OX seedlings (WT background) were grown on MS medium containing 1-μM PAC in the dark for 5 days, and were then treated with 100-μM GA3 + 1-μM PAC and exposed to the indicated light intensities of blue light for the indicated time. Two independent experiments were performed, and one is shown. The immunoblot results were quantified using ImageJ. RGA and GAI protein levels were normalized to the tubulin loading control and the levels at time 0 was set to 100. BL, blue light; DK, dark.

