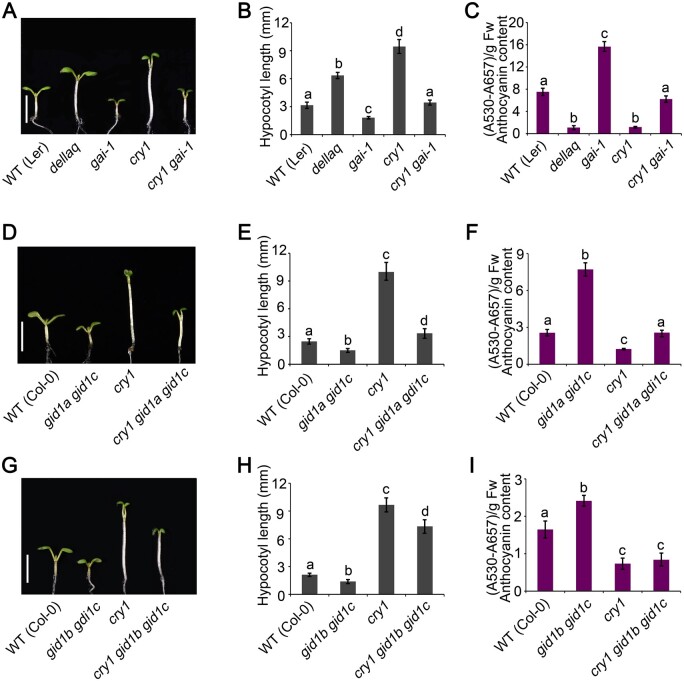
Figure 7.
GID1 and DELLA act genetically downstream from CRY1 to regulate photomorphogenesis. A, Representative phenotypes of gai-1 and cry1 gai-1 mutant seedlings grown in continuous blue light (30 μmol·m–2·s–1) for 5 days. Scale bars, 5 mm. B, C, Mean hypocotyl lengths and anthocyanin contents of the genotypes in (A). D, Representative phenotypes of gid1a gid1c and cry1 gid1a gid1c mutant seedlings grown in continuous blue light (30 μmol·m–2·s–1) for 5 days. Scale bars, 5 mm. E, F, Mean hypocotyl lengths and anthocyanin contents of the genotypes in (D). G, Representative phenotypes of gid1b gid1c and cry1 gid1b gid1c mutant seedlings grown in continuous blue light (30 μmol·m–2·s–1) for 5 days. Scale bars, 5 mm. H, I, Mean hypocotyl lengths and anthocyanin contents of the genotypes in (G). Data in (B), (E), and (H) are means ± sd (n = 30). Data in (C), (F), and (I) are means ± sd (n = 3). Letters “a” to “d” indicate statistically significant differences for the indicated values, as determined by a one-way analysis of variance (ANOVA), followed by Tukey’s least significant difference (LSD) test (P < 0.05).

