
Figure 1. Sleep and Brain changes in elderly and AD patients during the Lifespan.
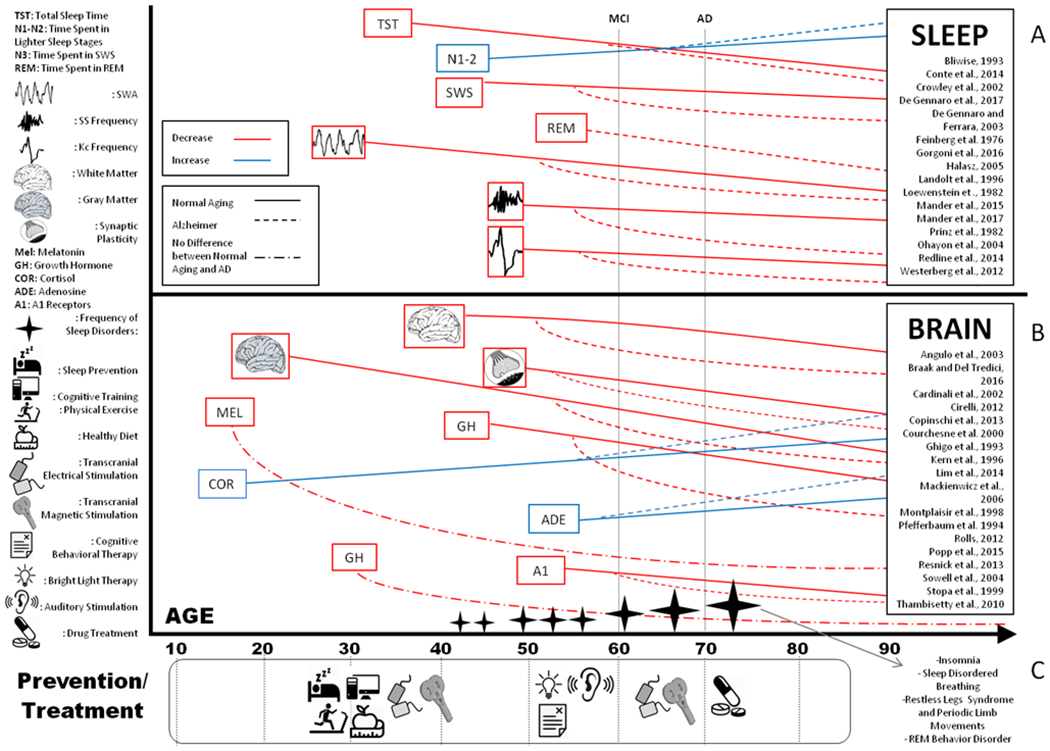
A comprehensive review of sleep modifications (panel A) and brain changes (panel B) in healthy aging individuals and AD patients. The items represent investigated and modified variables (red items show a decrease; blue items illustrate an increase). The mean age when MCI or AD is diagnosed is illustrated by vertical black dotted lines. The horizontal lines indicate the trajectories of sleep and brain changes. Sleep disruptions and cortical alterations start earlier than clinical symptoms’ appearance. Horizontal line slopes depict differences in sleep and cortical abnormalities between healthy elderly and MCI/AD. Black stars show the prevalence of sleep disorders while growing older. Panel C shows when prevention and potential treatment efficacy would be optimal. NiBS techniques (such as transcranial magnetic stimulation and transcranial electrical stimulation) are represented at different age for their applications in prevention and treatment.