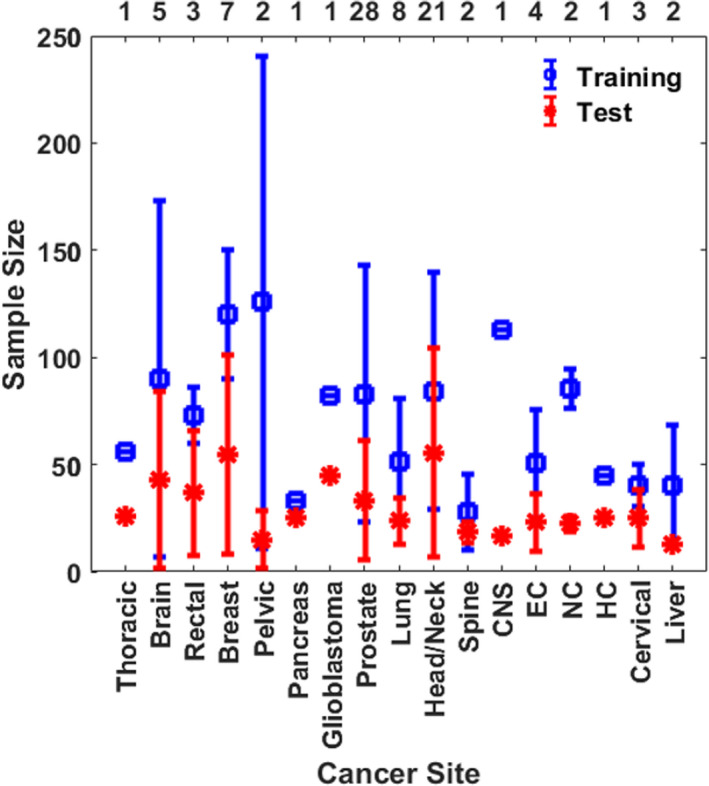
FIGURE 3.

The average number of training and testing datasets in traditional KBP dose prediction methods for each cancer site. The values are averaged over the number of investigations listed on the top x‐axis and the error bars represent standard deviation. CNS, Central Nervous System; NC, Nasopharyngeal Cancer; EC, Esophageal Cancer
