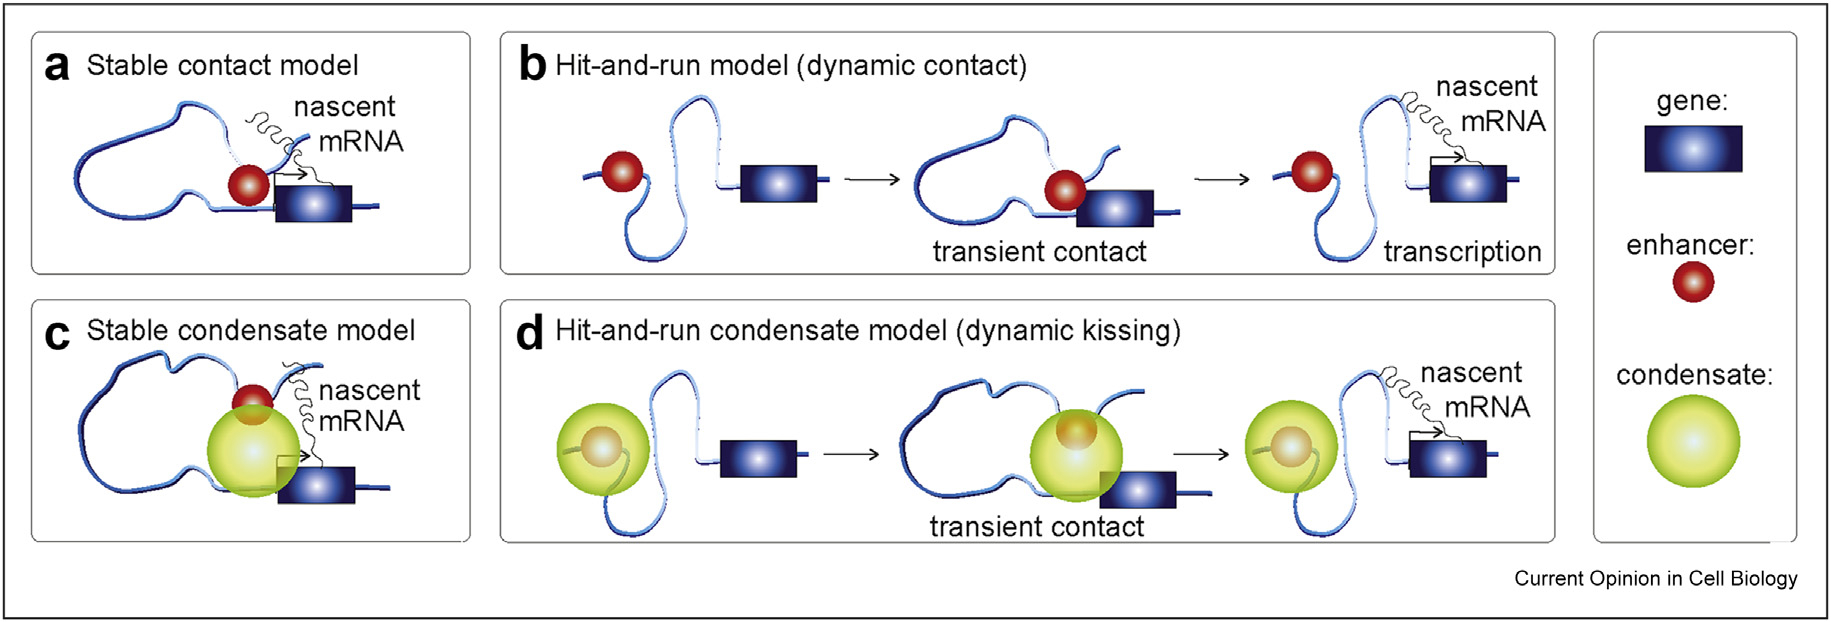
Figure 1. Models for enhancer–promoter (E–P) interactions:

(a) Stable contact or stable loop model. (b) Dynamic contact model (hit-and-run). (c) Stable condensate model. (d) Dynamic condensate model (hit-and-run or dynamic kissing). Black arrow at the gene indicates active transcription.
