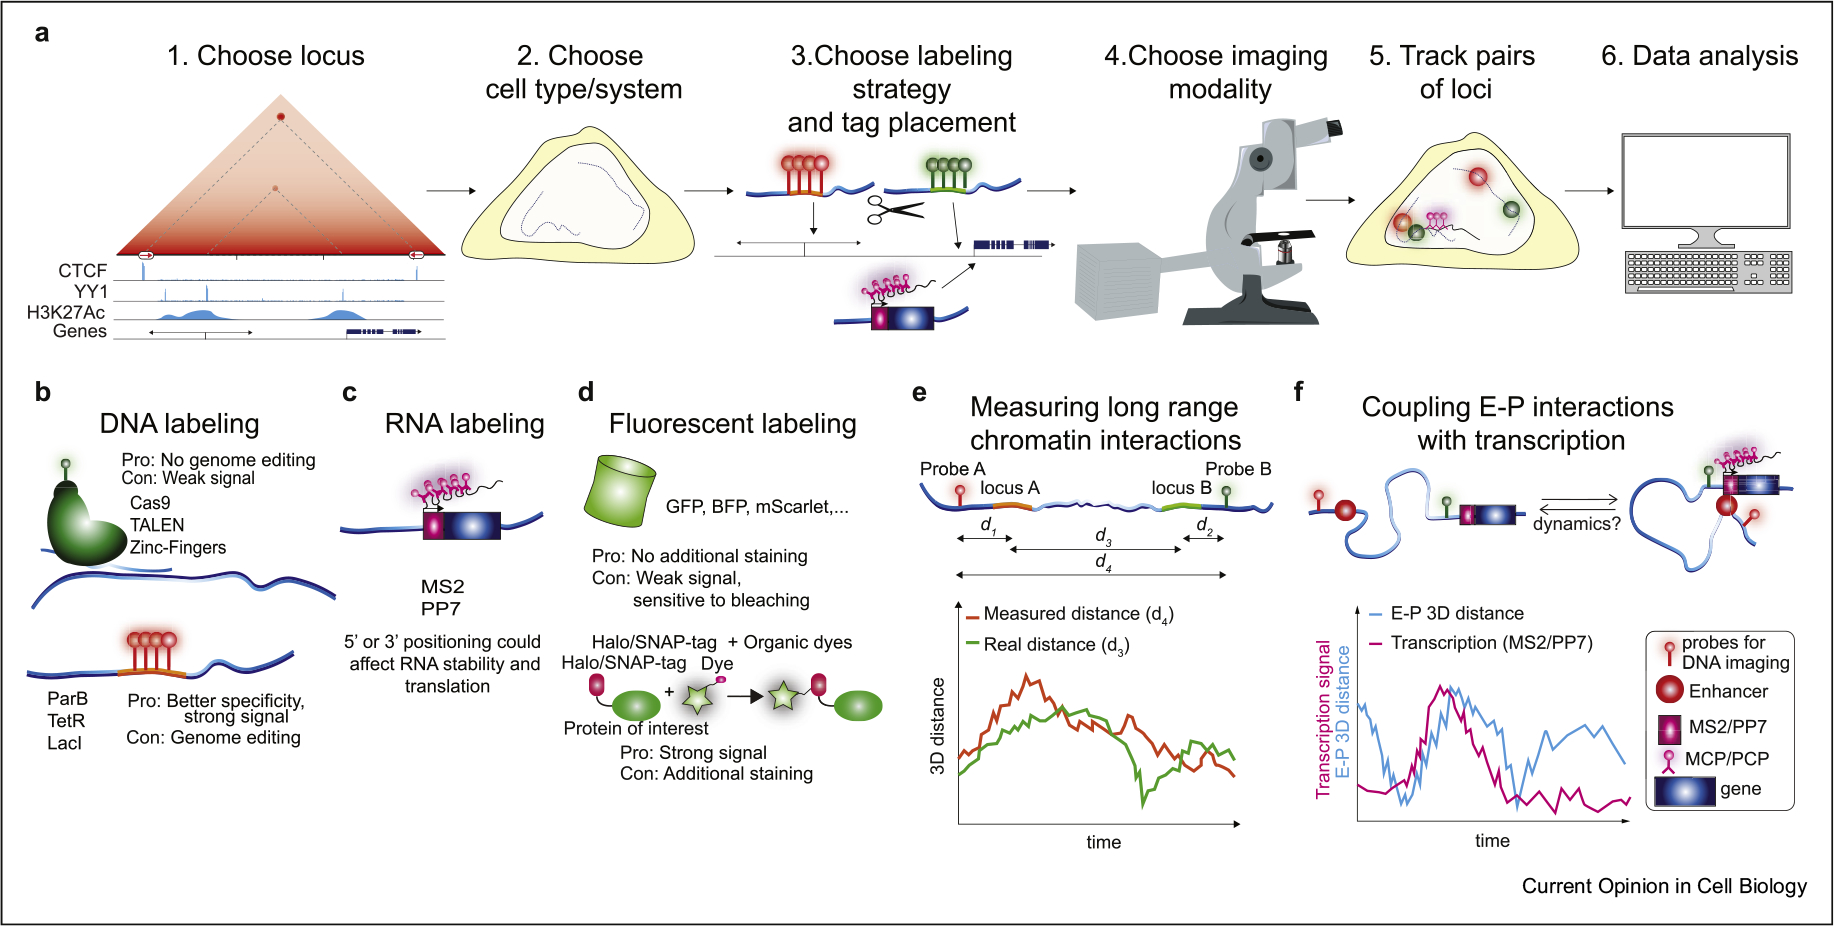
Figure 2. Workflow of SRLCI experiments, choice of biological system, and experimental design.

(a) Workflow diagram for SRLCI design, experiments, and analysis. (b) Methods for fluorescent DNA labeling: upper methodologies do not require genome engineering. The lower ones require genome engineering but may provide a higher signal-to-noise ratio. (c) RNA labeling is achieved through engineering with MS2 or PP7. 5ʹ-tagging provides better time resolution than 3ʹ-tagging at a higher risk of interfering with translation. (d) Fluorescent labeling can be accomplished with fluorescent proteins fused with the protein of interest or by fusion of Halo/SNAP-tag systems in combination with organic dyes, which provide a stronger signal. (e) Sketch of loci of interest, their distance, and the tether length between loci of interests and fluorescent labels. (f) Sketch of the putative relationship between 3D E–P distance and detected nascent transcription. SRLCI, super-resolution live-cell imaging.
