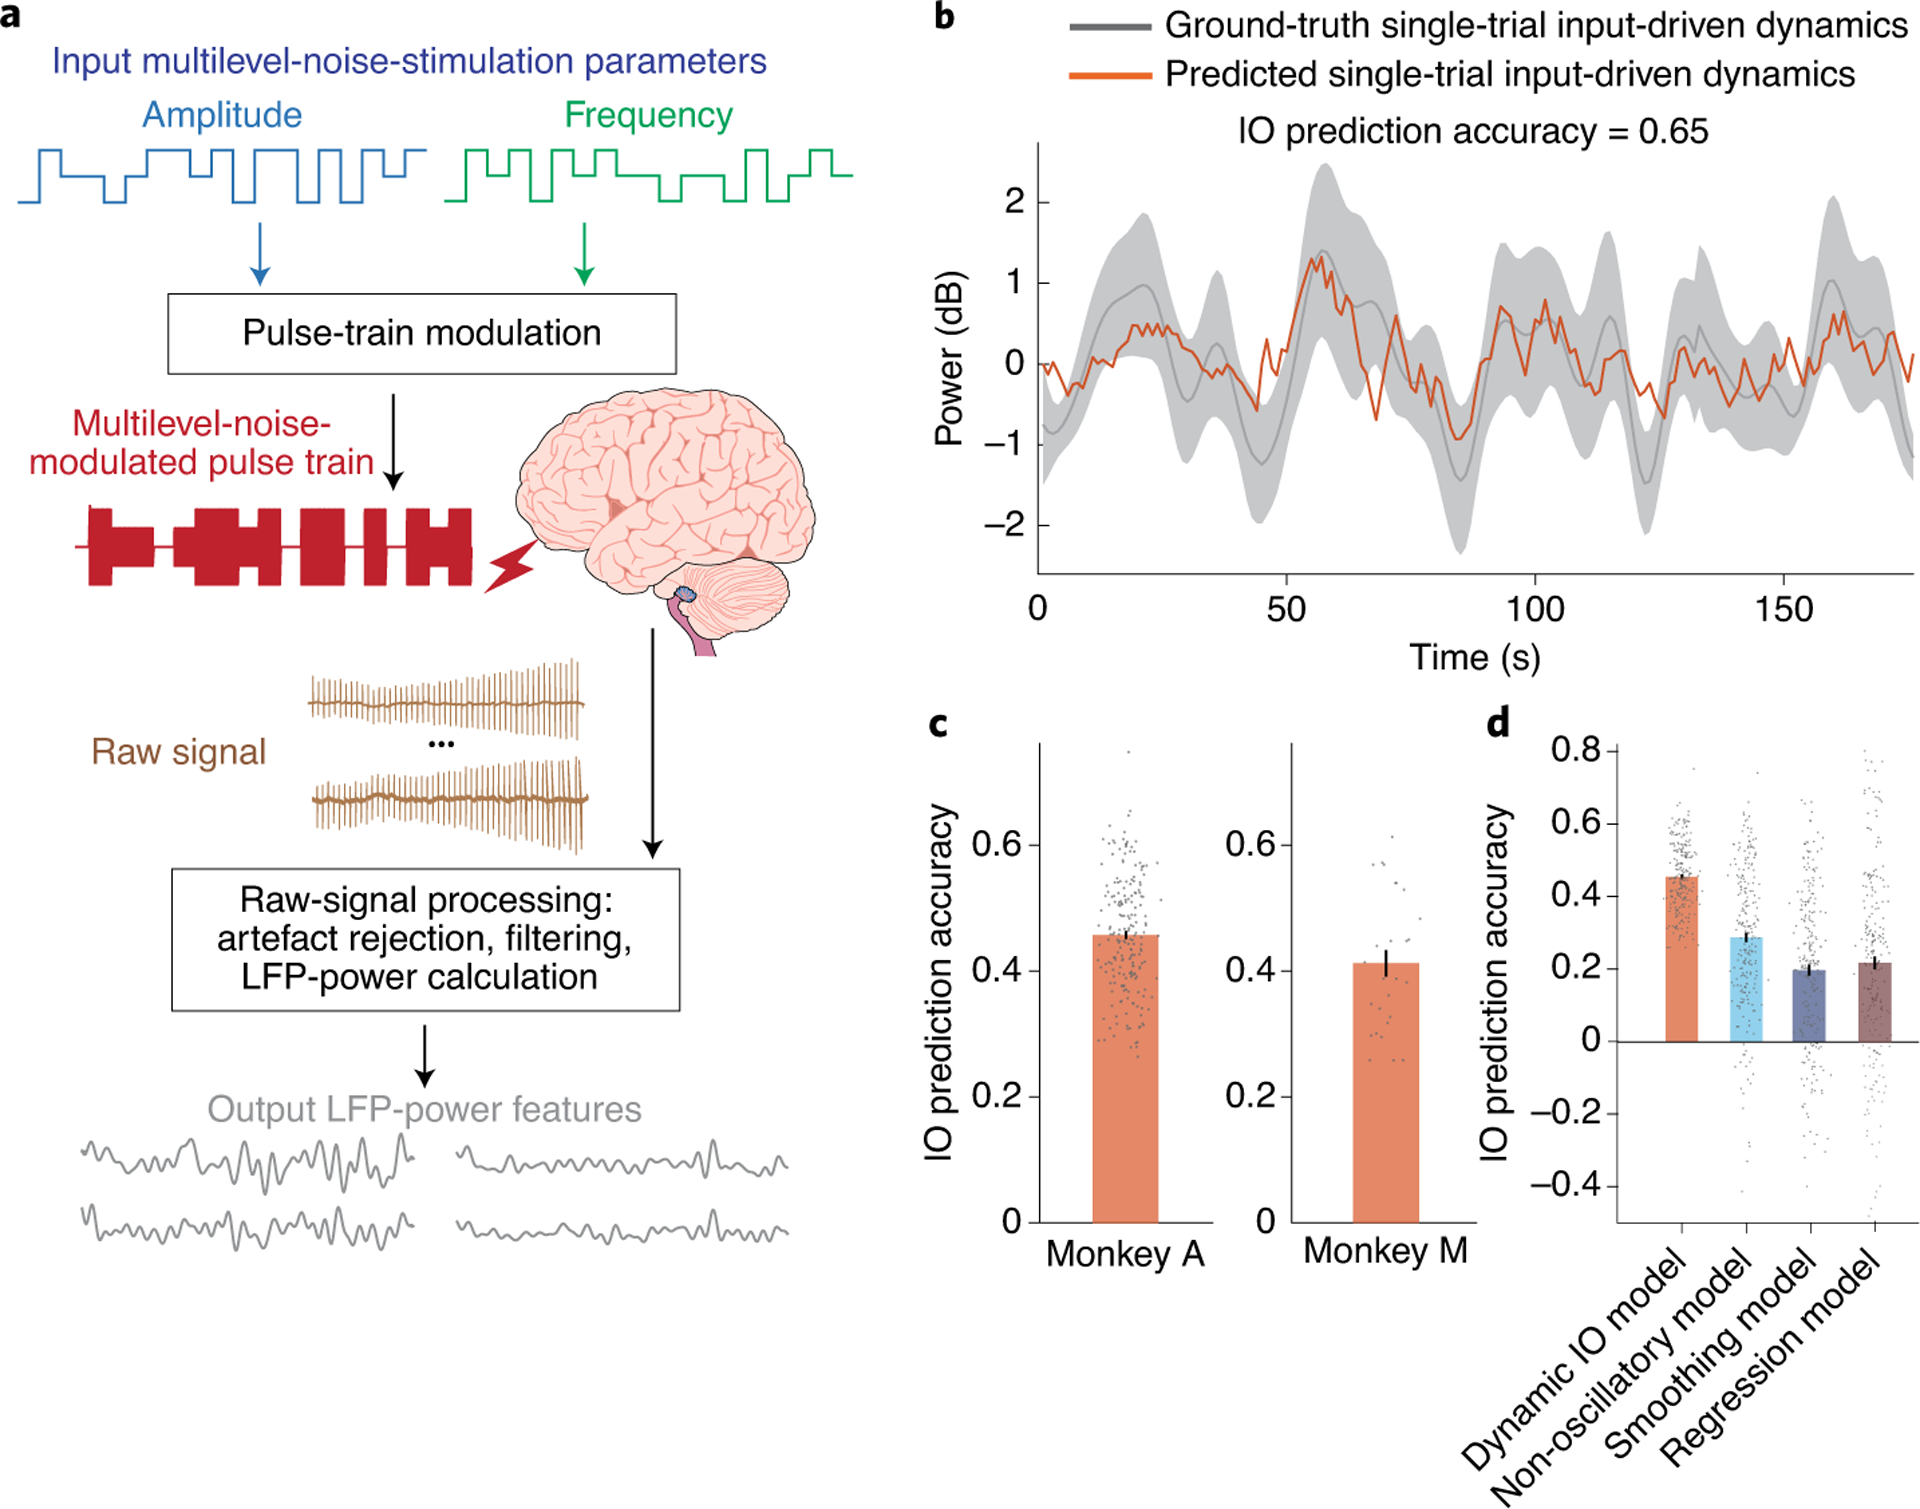
Fig. 1 |. Predicting network responses to DES by using a dynamic input–output model.

a, Microstimulation pulse-trains are modulated by independently generated amplitude and frequency time series that change stochastically between multiple levels. b, Example of a forward-prediction trace from the superior frontal gyrus in response to orbitofrontal cortex stimulation (orange). The grey solid line represents the ground-truth single-trial input-driven dynamics, and the grey area provides the standard error of the mean (s.e.m.) of the ground truth, which was computed from the measured LFP-power-spectrum features across trials. c, Prediction accuracies for predictable power-spectrum features for two monkeys. d, Forward-prediction accuracy of predictable power features for the dynamic model compared to non-oscillatory, smoothing and regression models across the two monkeys. In c and d, the error bars denote the mean and the s.e.m. The dots are the individual input–output (IO) prediction accuracies. Figure adapted with permission from ref.5, Springer Nature Ltd.
