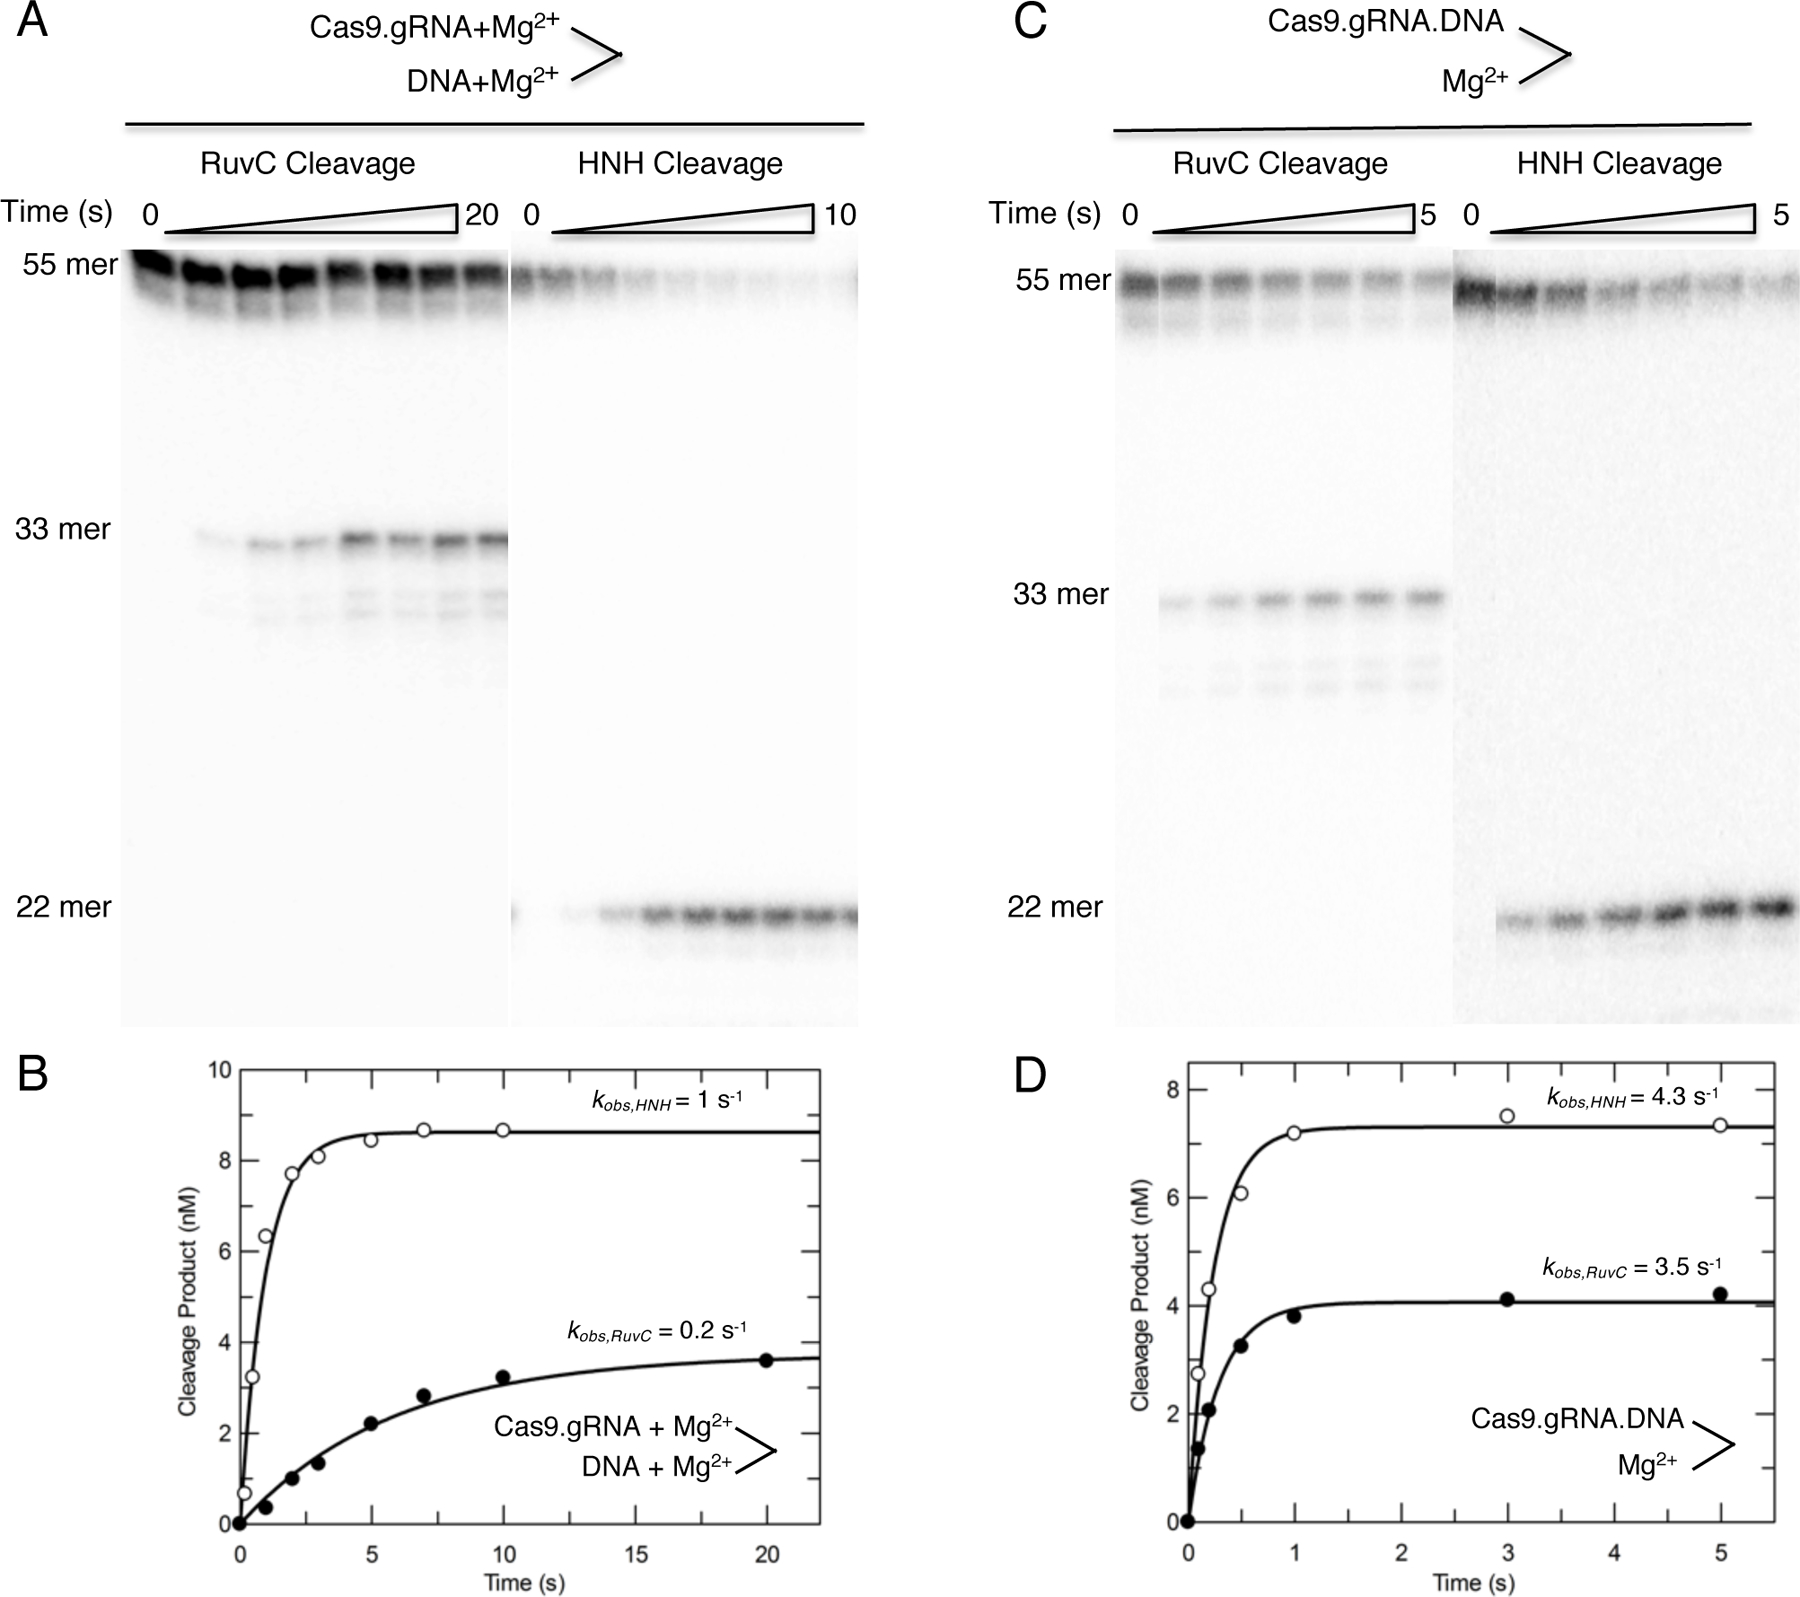
Figure 6.

(A) The HNH and RuvC time dependence experiments in Figure 5 were repeated over a shorter time scale. Cas9.gRNA was mixed simultaneously with DNA and Mg2+ to initiate the cleavage reaction. The scheme is shown above the gel image. (B) The plot of product formation as function of time was fit by a single-exponential equation to define the cleavage rates of 1 s−1 and 0.2 s−1 for the HNH and RuvC domains, respectively. (C) The experiments in (A) were repeated; however, Cas9.gRNA was preincubated with DNA for 30 min in the absence of Mg2+ followed by addition of Mg2+ to initiate the reaction. The scheme is shown above the gel image. (D) The plot of product formation as function of time was fit by a single-exponential equation to define the cleavage rates of 4.3 s−1 and 3.5 s−1 for the HNH and RuvC domains, respectively. These figures are adapted from Gong et al. 2018.
