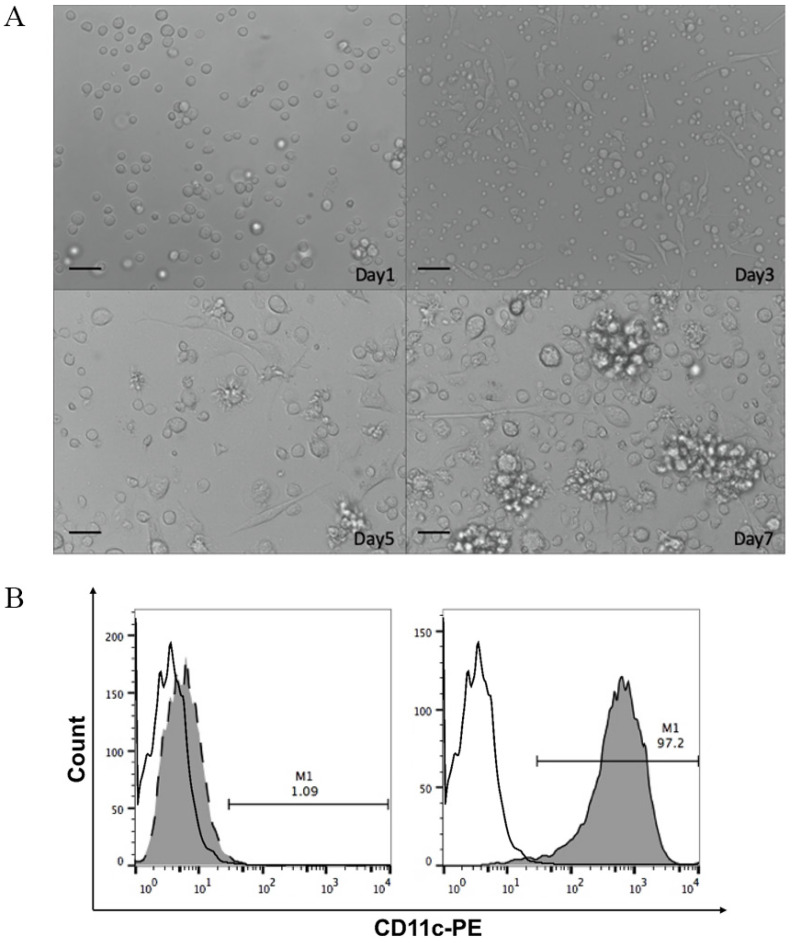
Figure 2.
A. Optical micrographs presenting the morphology of dendritic cells obtained by magnetic-activated cell sorting over 7 days. Scale bar, 100 μm. B. The percentage of CD11c+ cells in mononuclear cells isolated from bone marrow on day 0 (left panel) and immature bone marrow-derived dendritic cells from day 7 of culture (right panel) evaluated by flow cytometry. White, isotype control; grey, CD11c+ expression.

