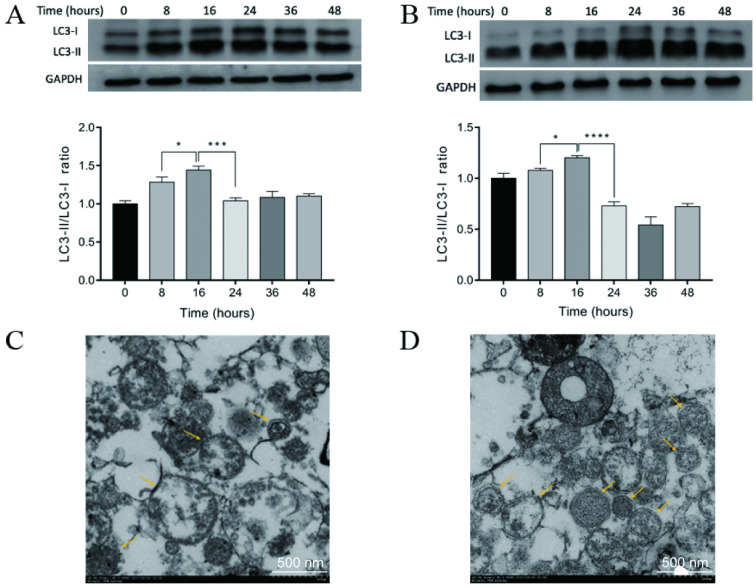
Figure 3.
A-B. Autophagosomal marker LC3 detected by Western blot analysis. LC3-I to LC3-II conversion of CT-26 cells (A) or CCSCs (B) reached a maximum at 16 h after induction for autophagy. *P<0.05, ***P<0.001, and ****P<0.0001. C-D. A transmission electron micrograph of DRibbles in CT-26 cells (C) and CCSCs (D). The arrows show DRibbles with typical double-membrane spheroid in the ranges of 200 - 900 nm. CCSC, colon cancer stem cell; SDS-PAGE, sodium dodecyl sulfate-polyacrylamide gel electrophoresis.

