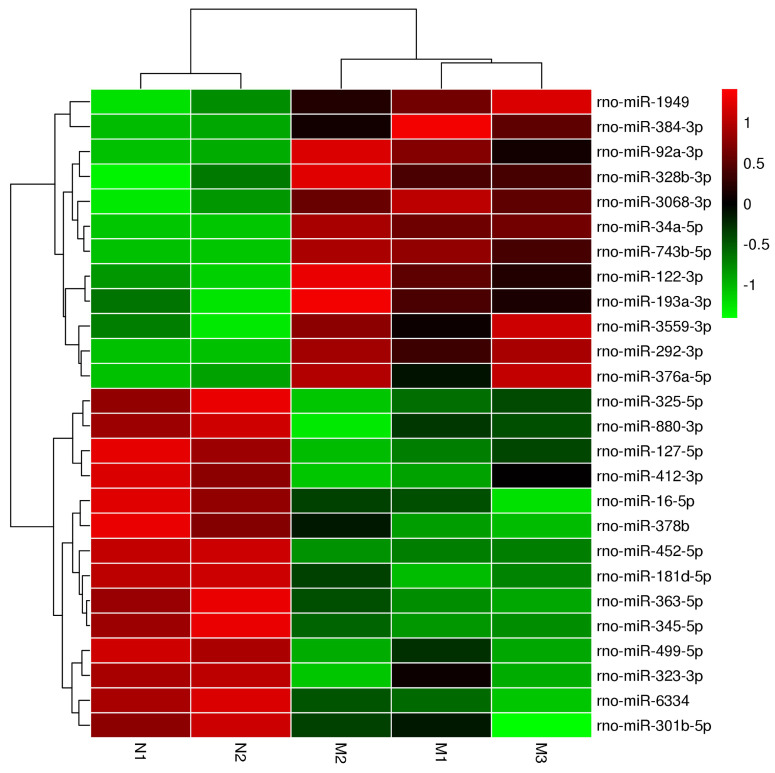
Figure 3.
The heatmap analysis of differentially expressed miRNAs. In the cluster heatmap expression analysis, the red color indicated high expression level, green indicated low expression, and black indicated that there was no expression. The darker the color looks, the higher or lower the expression level is. Number N1 and Number N2 are the control (ZL) samples, number M1, Number M2 and NumberM3 are the experimental (ZDF) samples.

