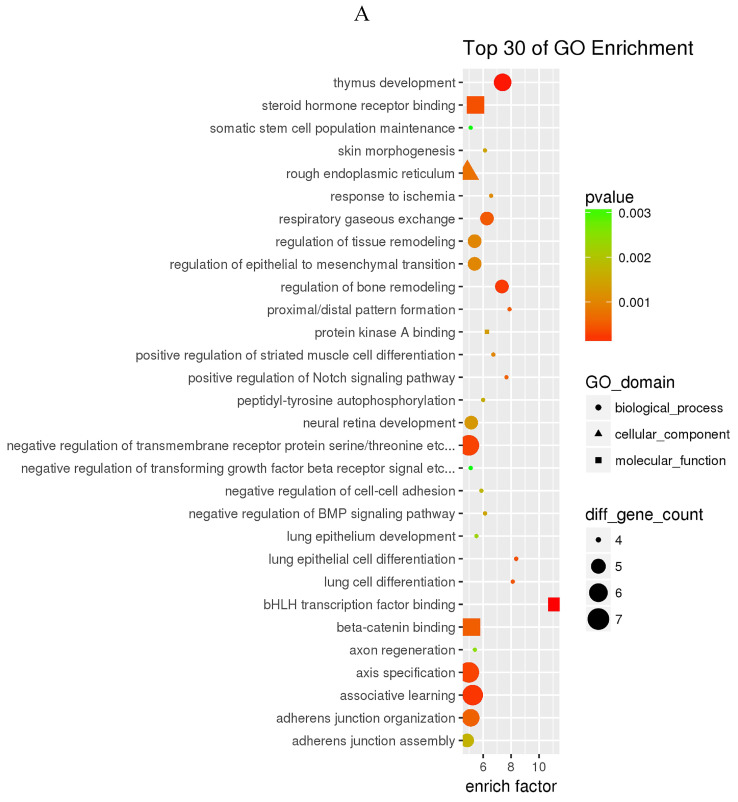
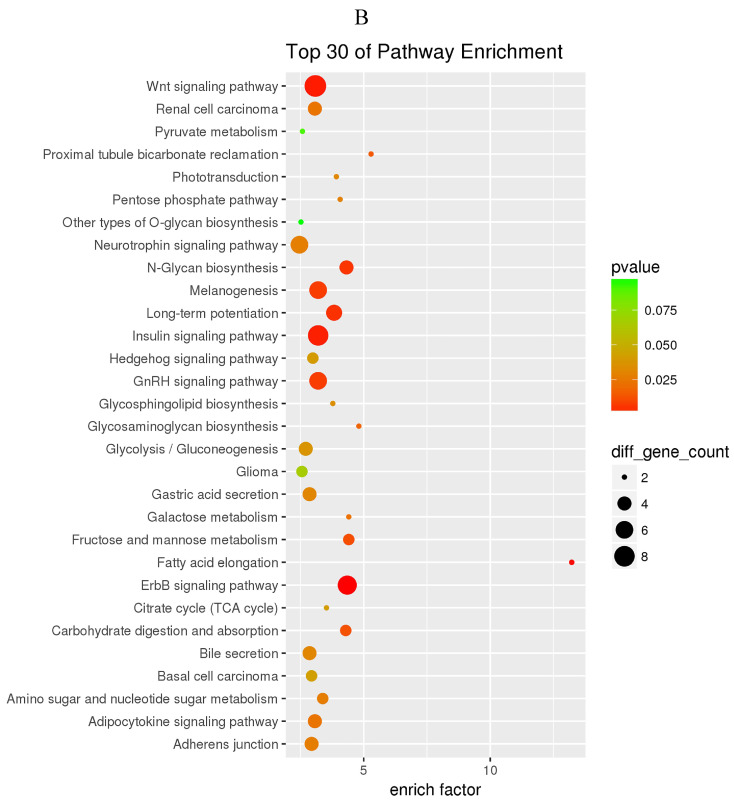
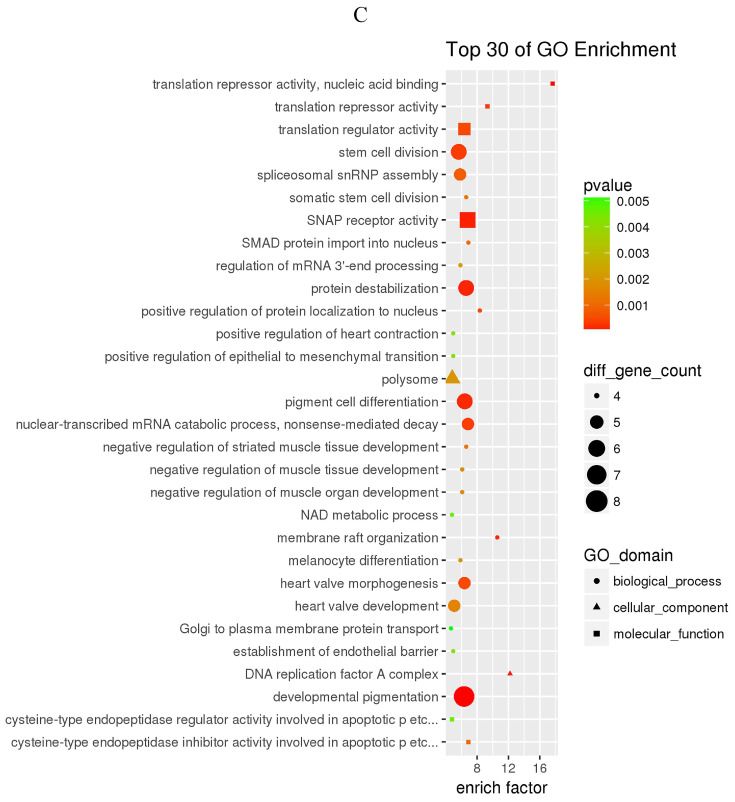
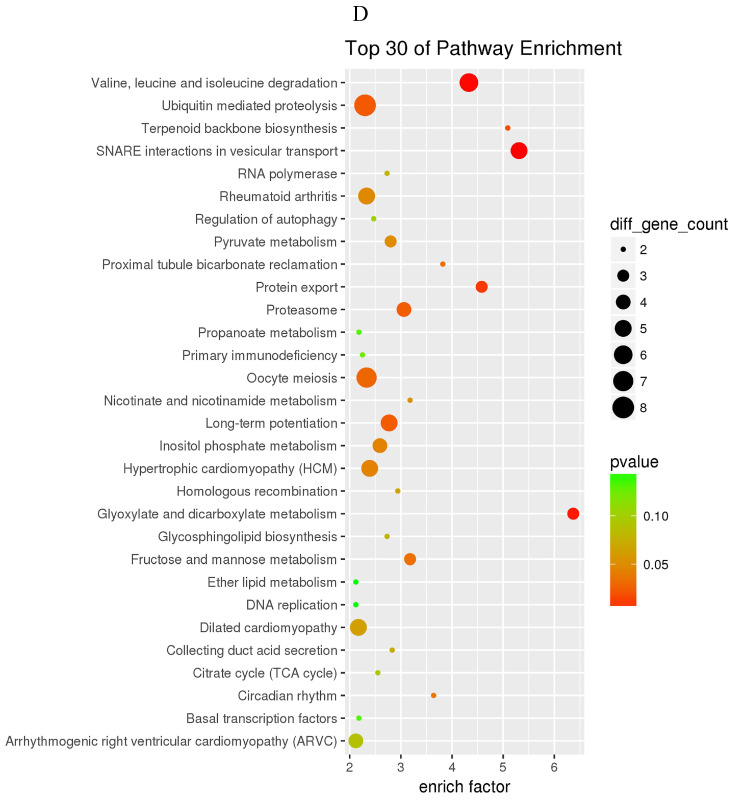
Figure 4.
GO and KEGG enrichment analyses of the predicted target genes of miR-34a-5p and miR-452-5p. In the GO enrichment analysis figures (A and C), the circle indicated biological process, triangle indicated cellular component, and square indicated molecular function. The size of the graph indicated the number of different genes in the related item, the color indicated the significance of the difference, and the more to right of their position, the higher the level of enrichment. In the KEGG enrichment analysis figures (B and D), the size of circles indicated the number of different genes in the related pathway, the color indicated the significance of the difference, and the more to right of their position, the higher the level of enrichment.


