Figure 2.
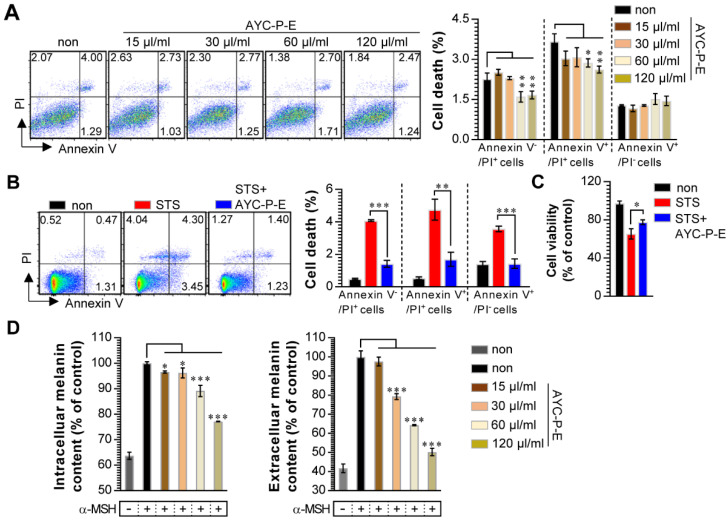
Effect of AYC-P-E treatment on melanin synthesis in α-MSH-treated B16F10 cells. (A and B) B16F10 cells were incubated with culture medium containing AYC-P-E at various concentrations (15, 30, 60, and 120 μl/ml) in the absence or presence of staurosporine (STS; 50 nM). After 72 h, cell viability and cell death (necrotic or apoptotic cell death) were measured using EZ-Cytox kit and Annexin V/PI staining, respectively. (A; left panel) The representative plot for Annexin V+/PI+, Annexin V+/PI-, or Annexin V-/PI+ B16F10 cells in AYC-P-E alone-treated condition. (A; right panel) The percentages of Annexin V+/PI+, Annexin V+/PI-, or Annexin V-/PI+ B16F10 cells in AYC-P-E alone-treated condition. (B; left panel) The representative plot for Annexin V+/PI+, Annexin V+/PI-, or Annexin V-/PI+ B16F10 cells in co-treatment condition with AYC-P-E (120 μl/ml) and STS (50 nM). (B; right panel) The percentages of Annexin V+/PI+, Annexin V+/PI-, or Annexin V-/PI+ B16F10 cells. (C) Cell viability in co-treatment condition with AYC-P-E (120 μl/ml) and STS (50 nM) was measured using EZ-Cytox kit. (D) The intracellular and extracellular melanin contents of B16F10 cells incubated with culture medium (phenol red-free) containing α-MSH (200 nM) for 1 h and treated with the indicated concentrations of AYC-P-E for 72 h. All bar graphs show the means ± standard deviation (SD) of three samples. One representative plot out of three independent experiments is shown; *P<0.05, **P<0.01, or ***P<0.001.

