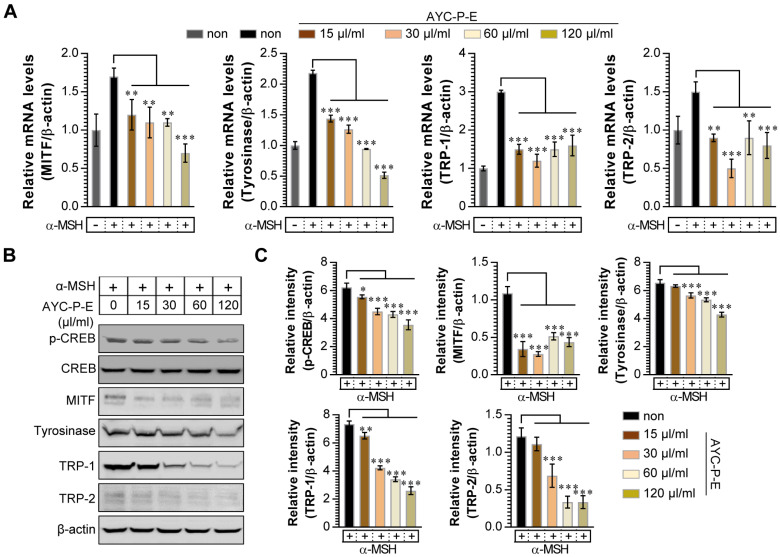
Figure 3.
Effect of AYC-P-E treatment on melanogenic protein and mRNA expression in α-MSH-stimulated B16F10 cells. (A and B) B16F10 cells were incubated with culture medium containing α-MSH (200 nM) for 1 h and treated with the indicated concentrations of AYC-P-E for 24 h. (A) The mRNA expression of MITF, tyrosinase, TRP-1, and TRP-2 was analyzed using real-time PCR. (B) Immunoblot analyses were performed using Abs specific to p-CREB (Ser133), MITF, tyrosinase, TRP-1, and TRP-2. CREB and β-actin was used as the protein loading control. (C) The relative intensity of each protein level is expressed as the mean in the bar graphs. All bar graphs show the means ± standard deviation (SD) of three samples. One representative plot out of three independent experiments is shown; **P<0.01, or ***P<0.001.

