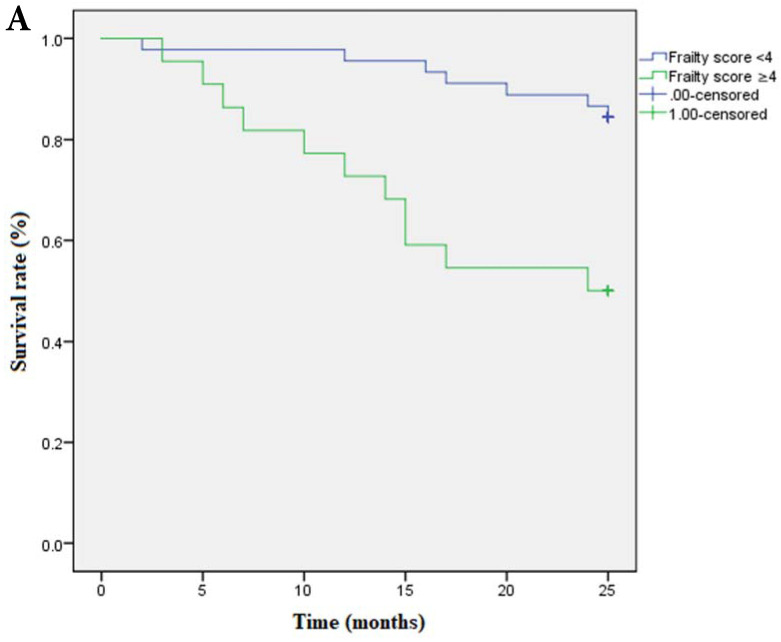
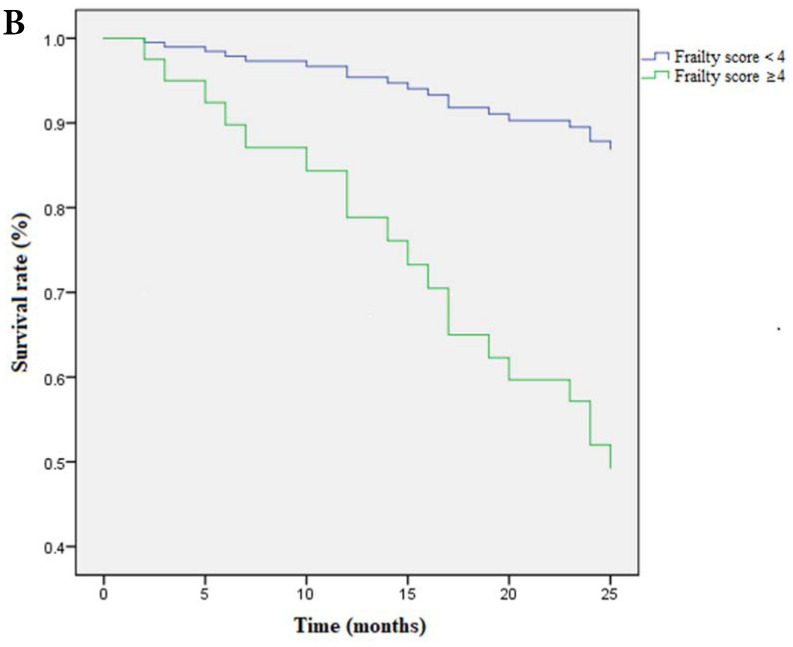
Figure 3.
A Kaplan-Meier curve based on frailty scores and mortality. Note: Frailty score≥4 is set as 1, <4 is set as 0; death is set as 1, survival is set as 0. OR of frailty score≥4 is 1.680 (95%CI:15.025-21.612); OR of frailty score<4 is 0.675 ( 95%CI: 22.365-25.013). P=0.001. B Survival curve based on frailty scores and mortality after adjusted for covariates. Covariates include age, ratio of ultrafiltration volume to dry weight, Hb and CAD. Data of frailty score are presented as numbers and death is set as 1, survival is set as 0. Note: Frailty score≥4 is set as 1, <4 is set as 0; death is set as 1, survival is set as 0. OR of frailty score≥4 is 1.673 (95%CI:16.109-21.633); OR of frailty score<4 is 0.690 (95%CI: 22.307-25.011). P=0.001.


