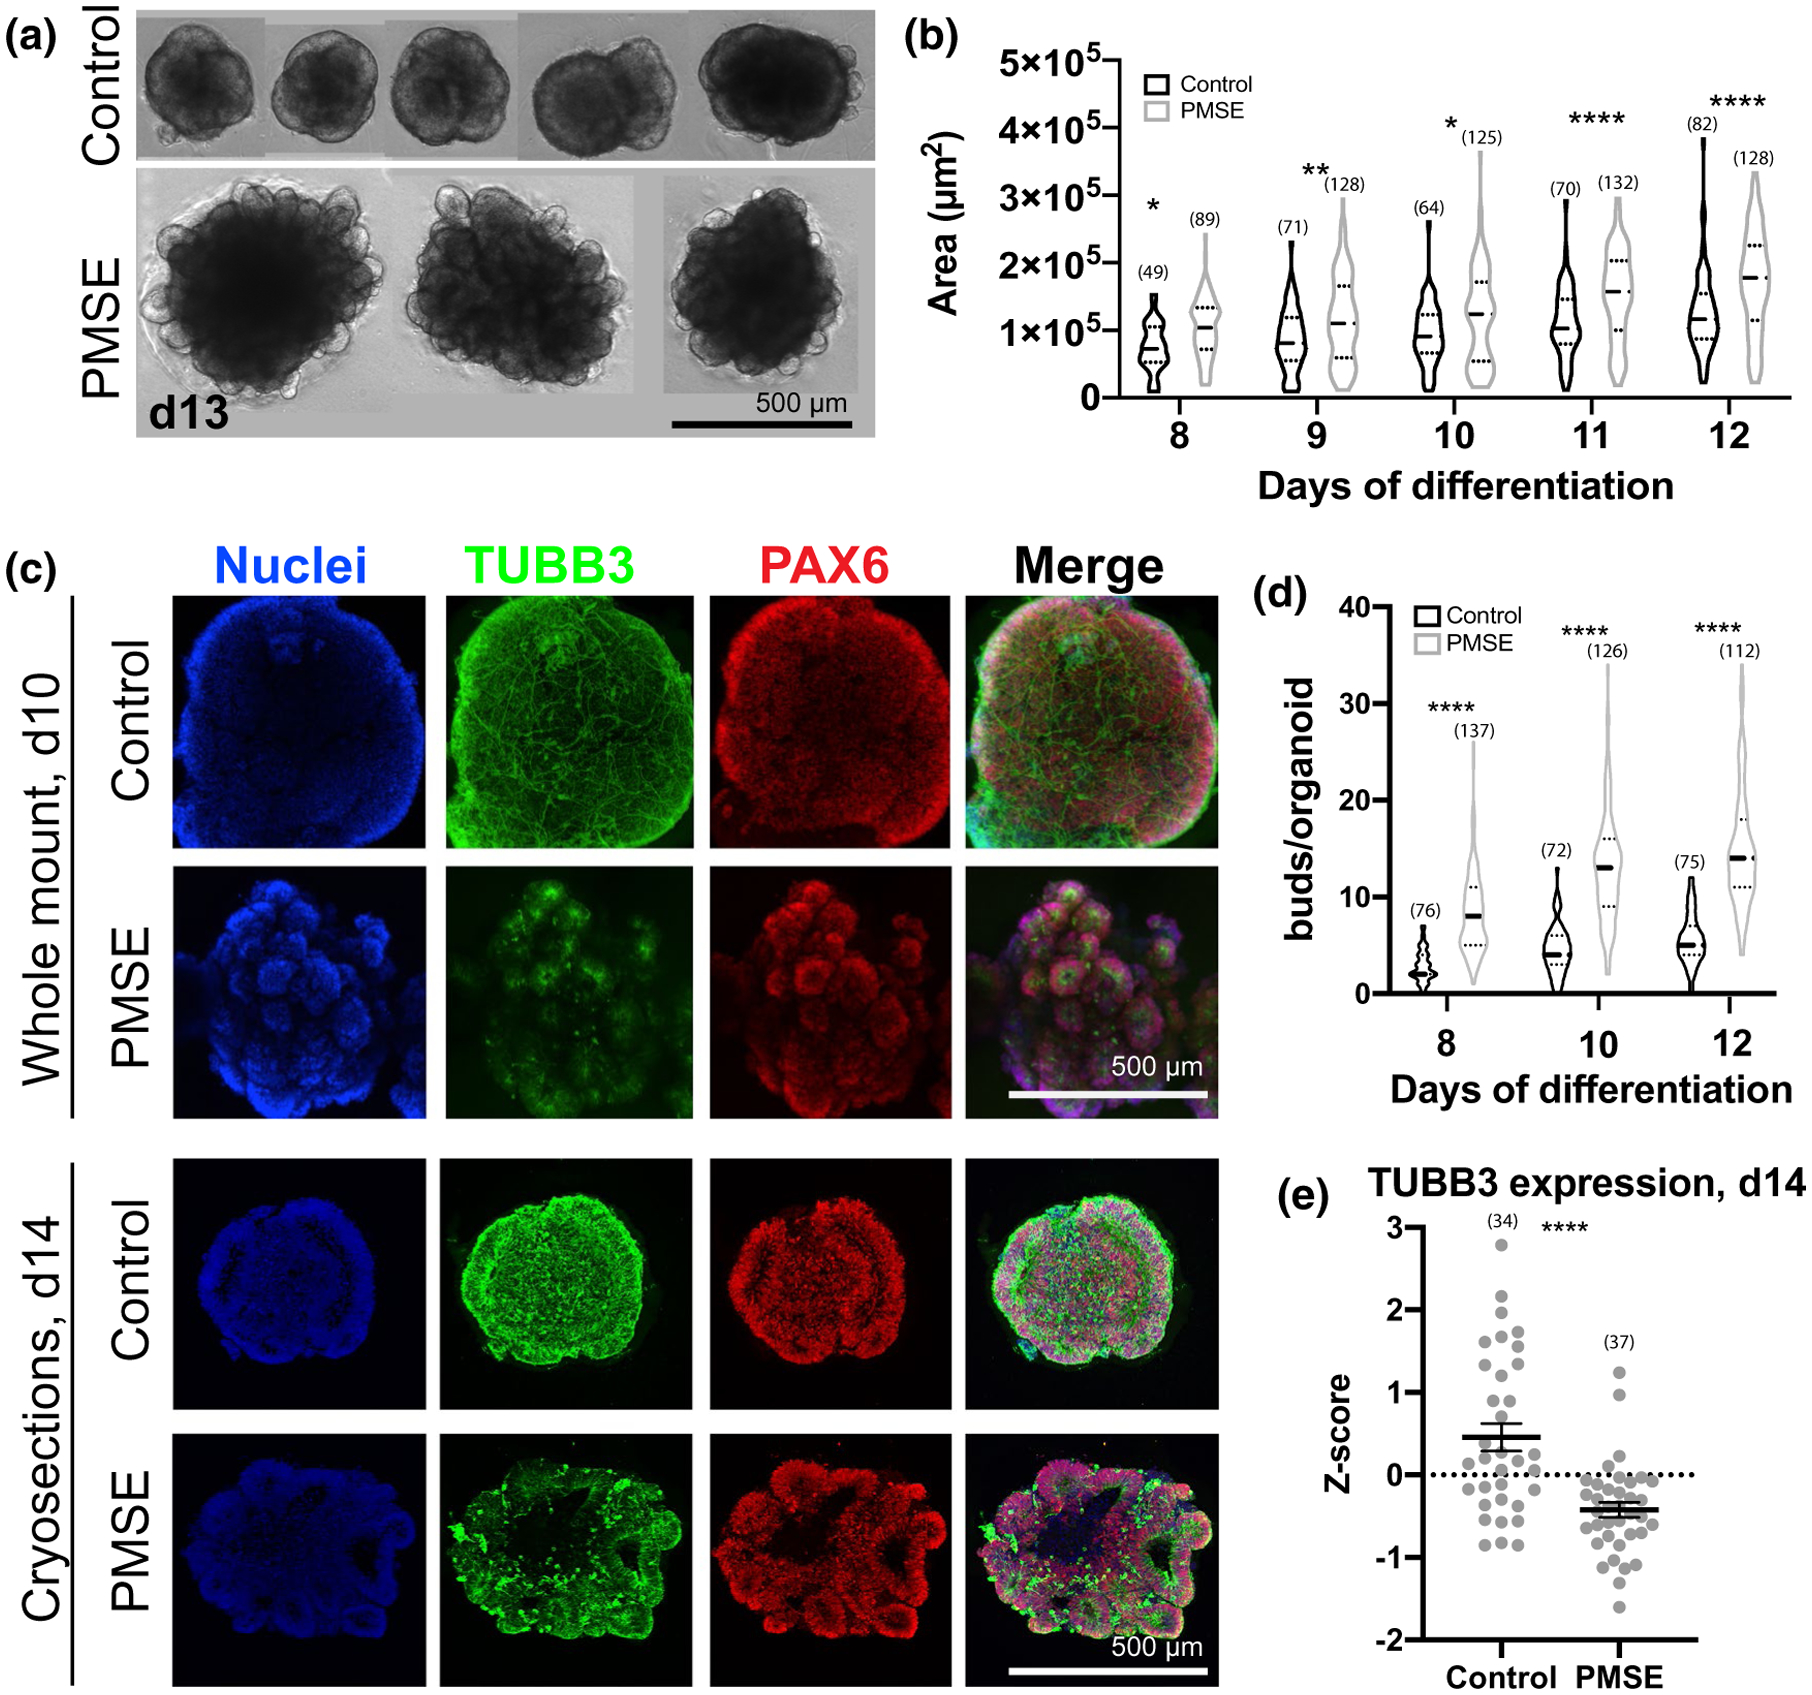
FIGURE 2.

PMSE organoids at days 8–14 demonstrated increased size, increased neuroepithelial budding, and a decrease in neuronal differentiation. (a) Phase-contrast images of day (d) 13 hCOs demonstrated increased size, and prominent neuroepithelial budding in representative PMSE hCOs. (b) Violin plots showing quantitation of hCO size from phase-contrast images taken at 8–12 days in vitro. Each data point corresponded to a single hCO, and data were compiled from three separate differentiations. At each time point, PMSE hCOs were significantly larger than the controls. Solid lines represent the median, and the dotted lines represent the 25th and 75th percentiles. (c) Whole-mount day 10 (top two rows) and cryosectioned day 14 (bottom two rows) control and PMSE hCOs were immunostained with TUBB3 to label neurons and PAX6 to label neural stem cells. Control hCOs had increased TUBB3 expression and had neurons coursing through the hCO, particularly evident with whole-mount stains. The PAX6+ neuroepithelial buds were larger but fewer and more contiguous in control hCOs, and more numerous but smaller in PMSE. (d) Violin plots of the number of neuroepithelial buds around the perimeter of control and PMSE hCOs at days 8, 10, and 12, with each data point representing a single hCO. There were significantly greater neuroepithelial buds in PMSE at all time points. Solid lines represent the median, and the dotted lines represent the 25th and 75th percentiles. (e) Quantification of TUBB3 in day 14 cryosections demonstrated a lower level of expression in PMSE. Each dot represents one image, and data were compiled from four separate differentiations. Mean ± SEM is displayed. *p < .05, **p < .01, ***p < .001, ****p < .0001. Numbers of hCOs measured are noted in parentheses in all graphs. Scale bars = 500 μm
