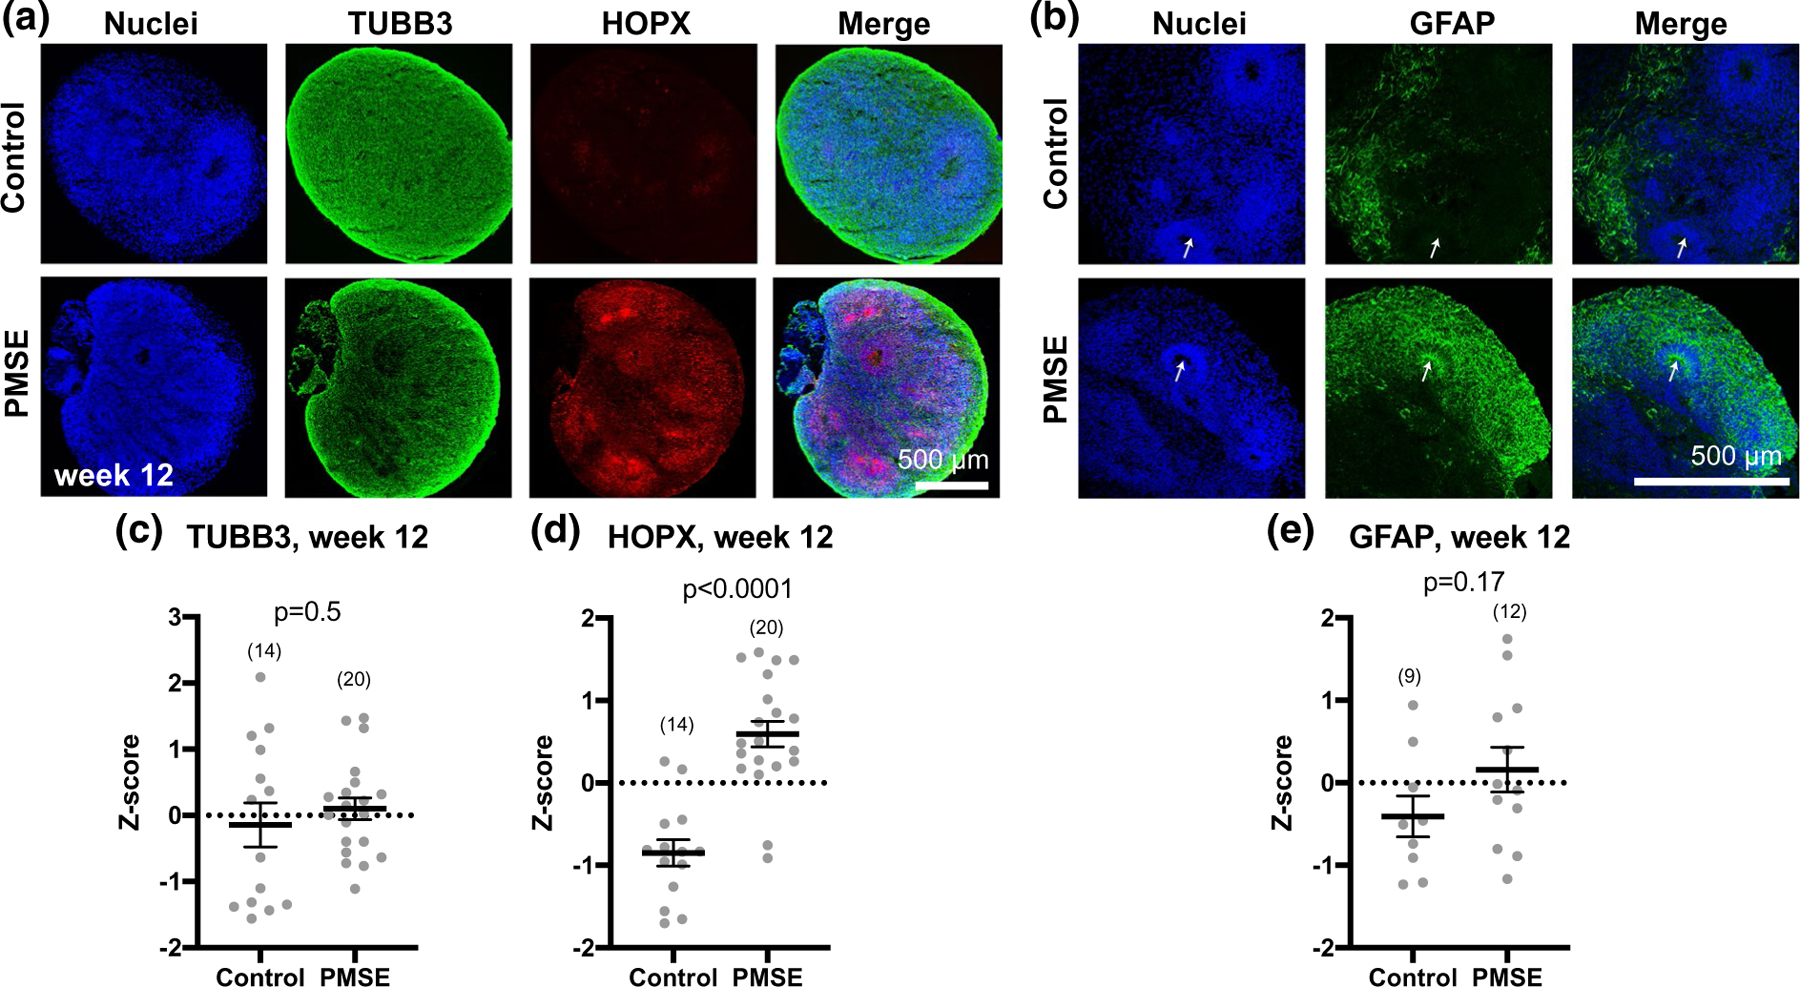
FIGURE 8.

PMSE organoids at week 12 had increased outer radial glial, but no significant difference in neuronal or astroglial markers. (a) PMSE hCOs had significantly increased numbers of HOPX+ outer radial glia compared to controls, but similar numbers of TUBB3+ neurons. (b) GFAP expression was not significantly different in PMSE versus control hCOs, although the pattern of expression was different, with more GFAP+ staining in neural rosettes of PMSE hCOs (arrows). (c–e) Quantification of cell markers revealed a significant increase in HOPX expression in PMSE hCOs, with no significant differences in neurons or astrocytes. Mean ± SEM is displayed. Each dot represents a separate image of an organoid (total numbers in parentheses). Data were compiled from three independent differentiations. Scale bars = 500 μm
