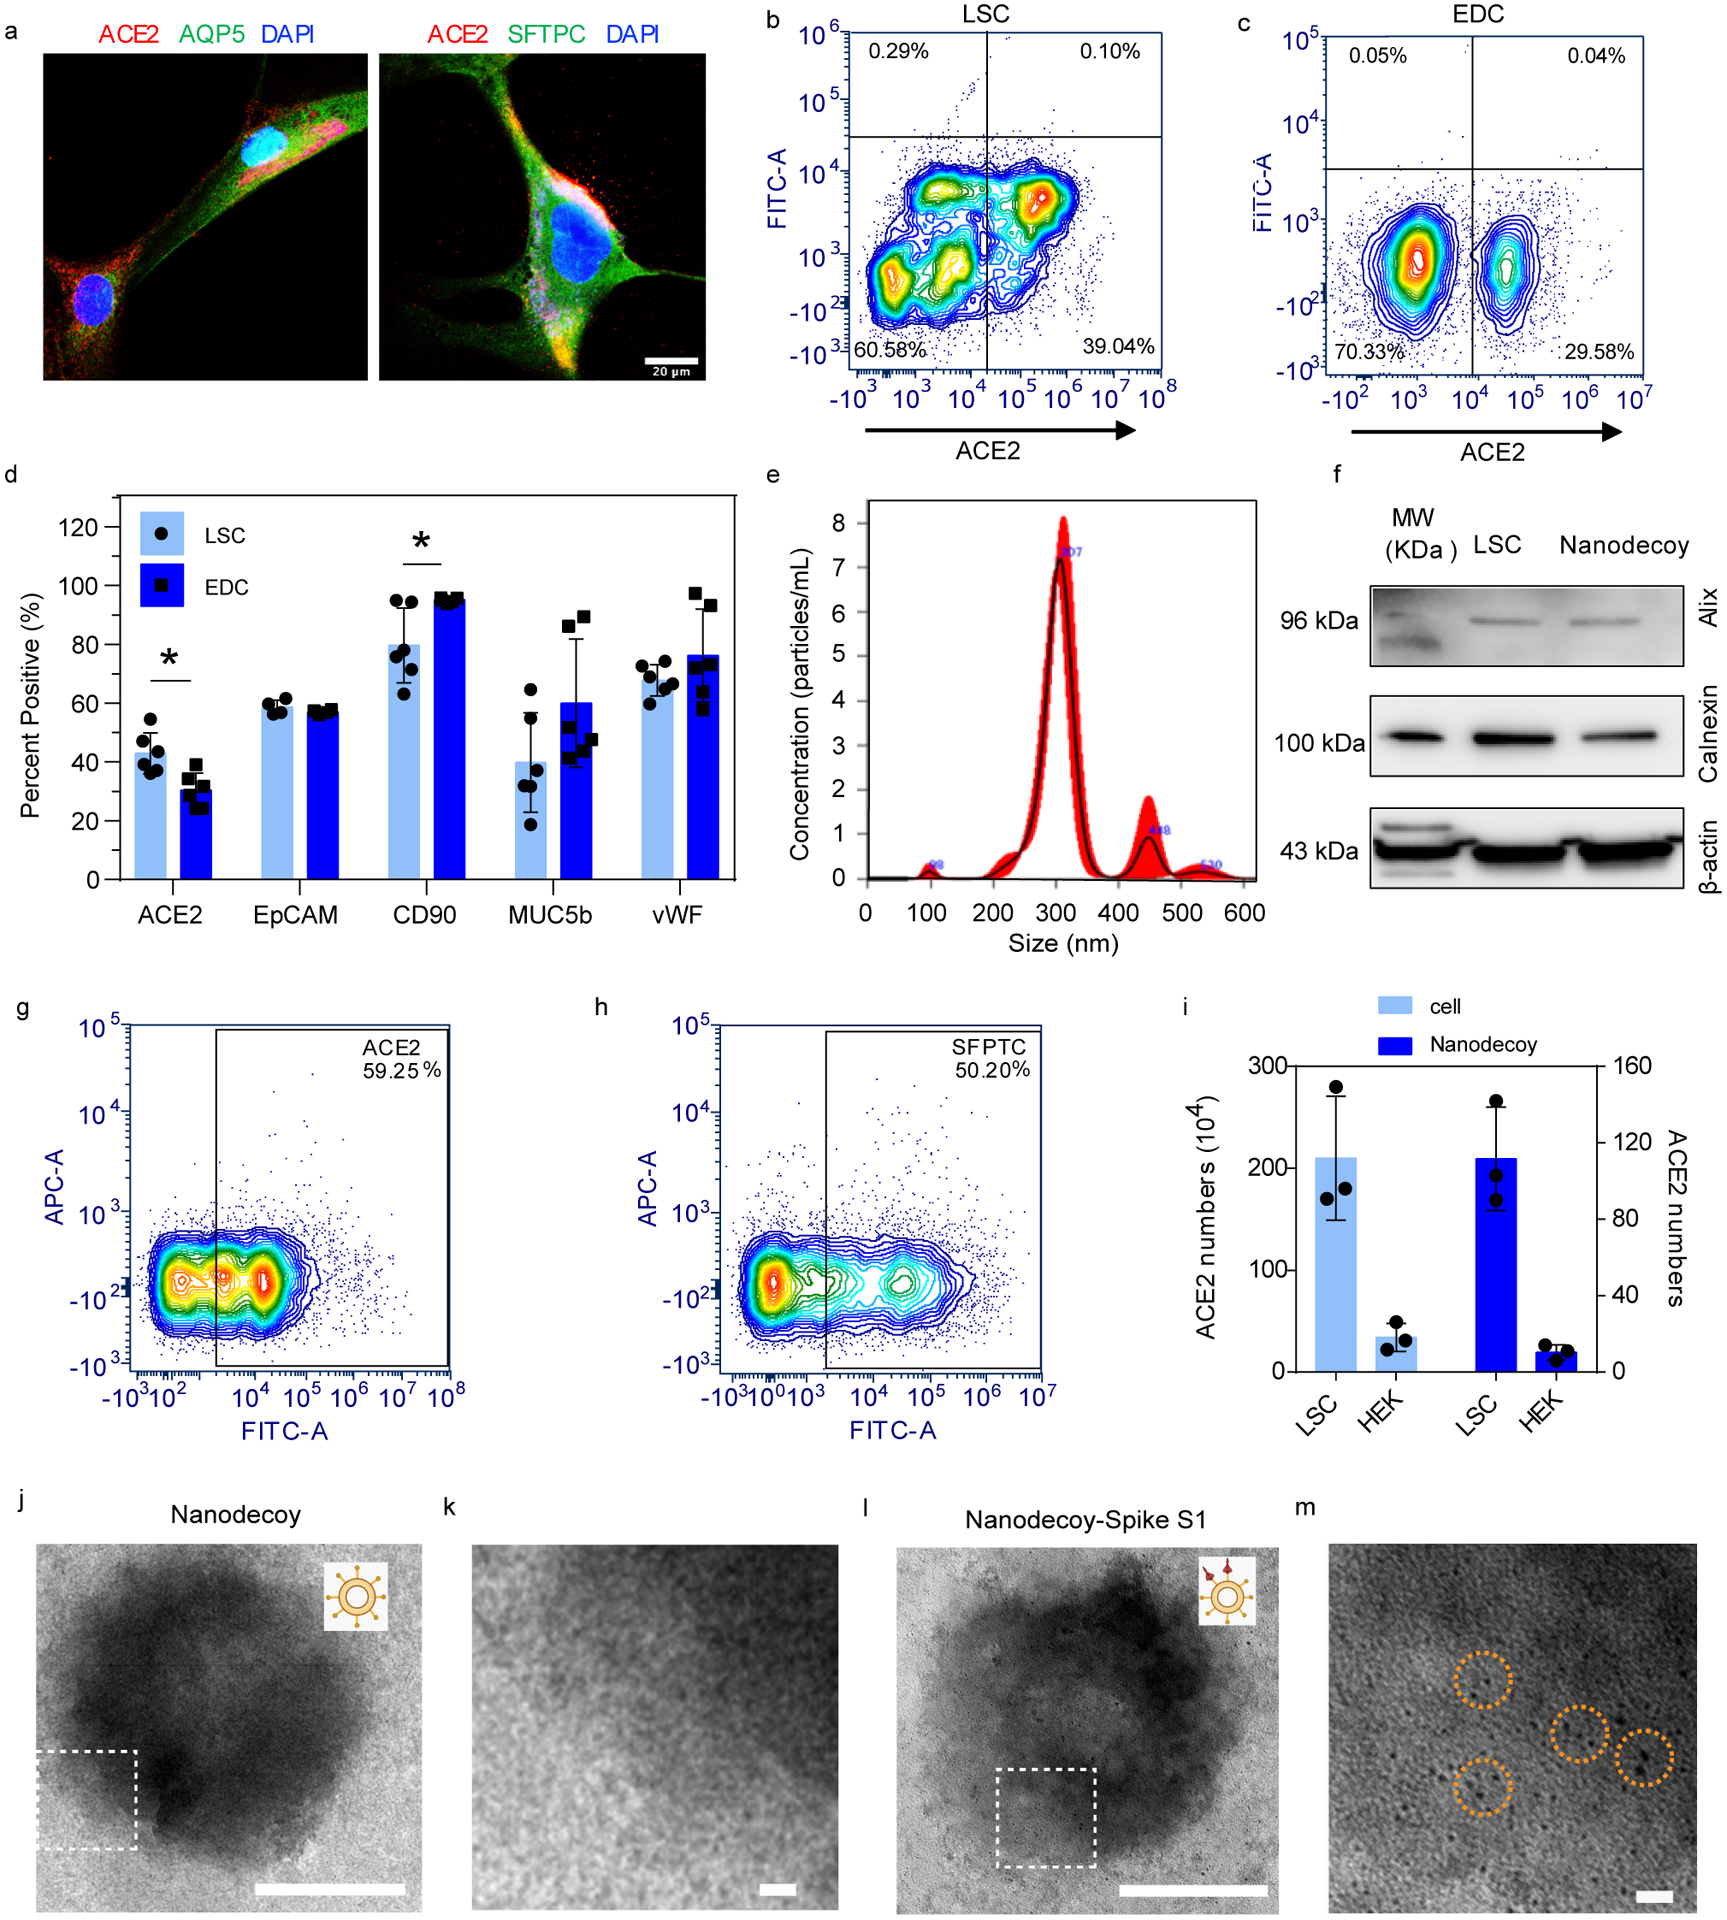
Figure 1. Characterizations of lung spheroid cell-derived nanodecoys.

(a) Representative confocal images of LSCs labeled with ACE2, AQP5, and SFTPC antibodies. Three images were taken. Scale bars, 20 μm. (b) Representative flow cytometry analysis of LSCs (b) and EDCs (c) for ACE2 expression and (d) quantitative results of flow cytometry analysis of EDCs and LSCs for ACE2, EpCAM, CD90, MUC5b, and vWF. Data are shown as mean ± SD, n=4 or 6 independent experiments. Statistical analysis was performed by two-way ANOVA with a Tukey post hoc test. See Supplementary Figure S17 for gating strategies. (e) Size measurement of nanodecoys using NTA Nanosight. (f) Western blot of Alix and Calnexin in LSC-nanodecoys and LSCs. Flow cytometry analysis showing the expressions of ACE2 (g) and type II pneumocytes maker SFPTC (h) on LSC-nanodecoys. See Supplementary Figure S17 for gating strategies. (i) Measurement of ACE2 numbers on both cells and nanodecoys. HEK indicates HEK293. Data are shown as mean ± SD, n=3 independent experiments. Transmission electron microscopy (TEM) images showing naked nanodecoys (j) and enlarged figure (k). TEM images showing spike S1-bound nanodecoys (l) and enlarged figure (m). Spike S1 was detected using gold nanoparticle-labeled secondary antibodies with diameters of 10 nm. Cartoon pictures (insets in Figure j and l) were created with BioRender.com.
