
Figure 4. Biodistribution of nanodecoys after inhalation.
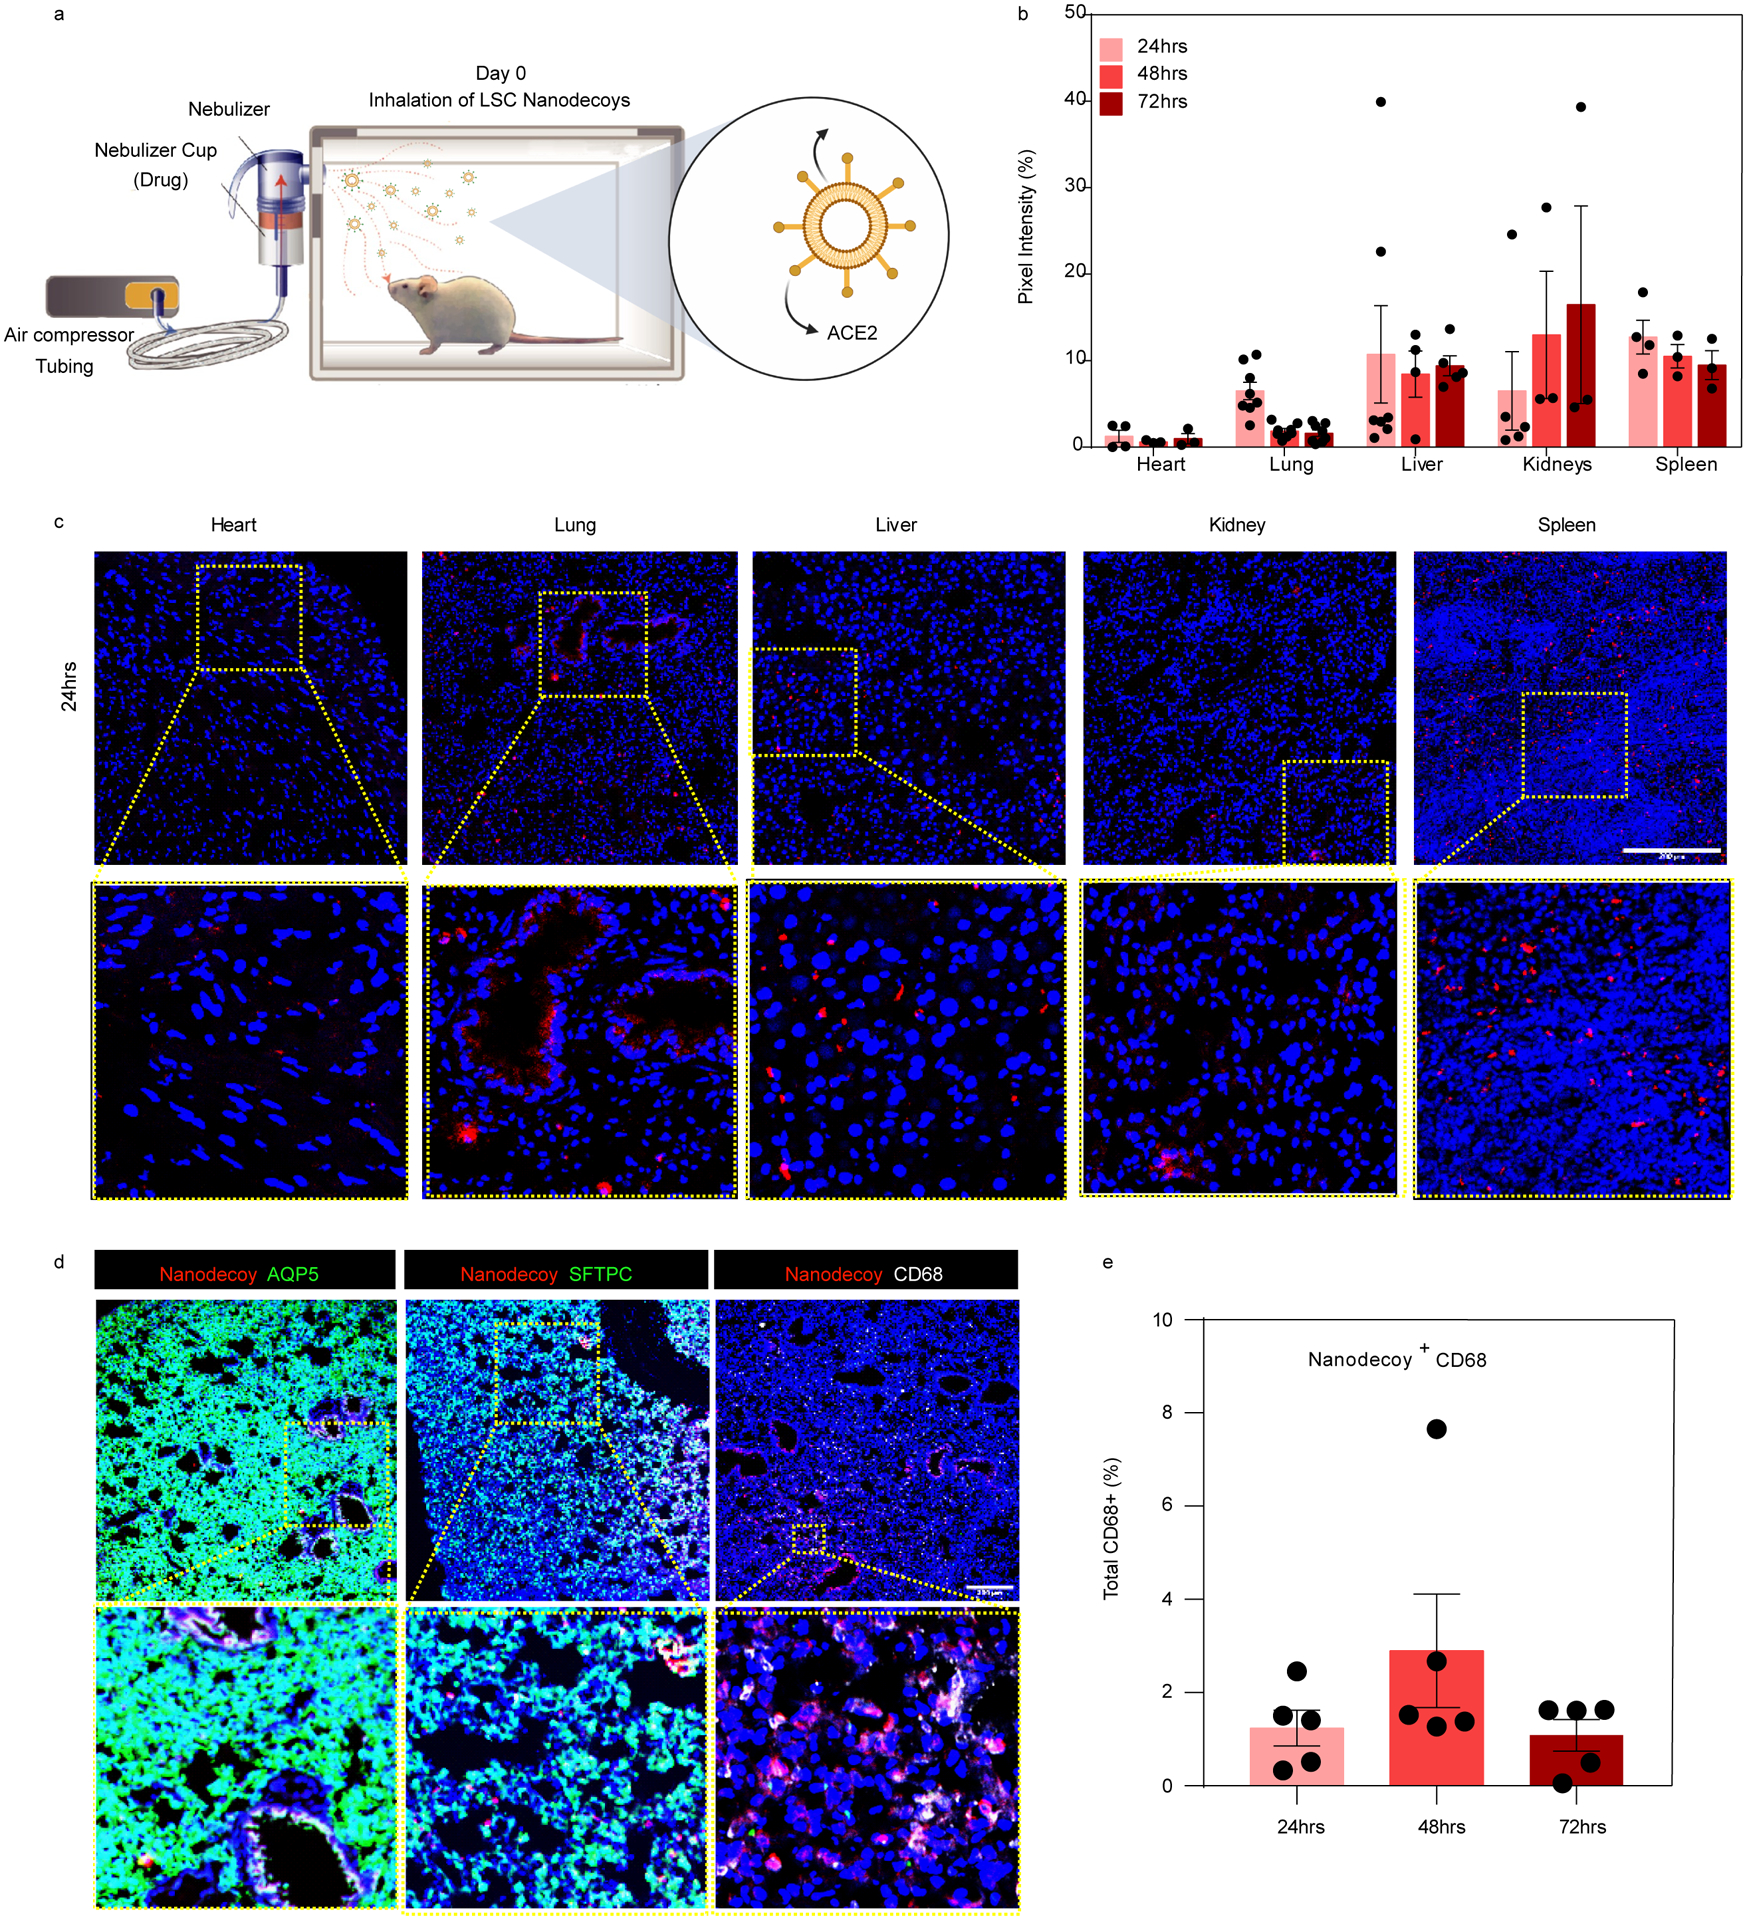
(a) Schematic showing study design of nanodecoy inhalation in CD1 mice. Created with BioRender.com. (b) Corresponding quantitative results from (c) of DiD-labeled nanodecoys in heart, lung, liver, kidney, and spleen tissues. Data are shown as mean ± SD, n=3 animals. At least three images were taken. (c) Representative confocal images of DiD-labeled nanodecoys (red) in tissue sections. (d) Representative confocal images showing nanodecoys in lung tissues co-localizing with lung cells (AQP5, SFTPC) and macrophages (CD68) 24 hrs post-inhalation. Five images were taken. (e) Quantification of the percent of nanodecoy-positive macrophages. Data are shown as mean ± SD, n=3 animals. Scale bars, 200 μm for Figure 4c–d.