
Figure 5. Nanodecoy inhalation accelerates the clearance of the SARS-CoV-2 mimic viruses in a mouse model.
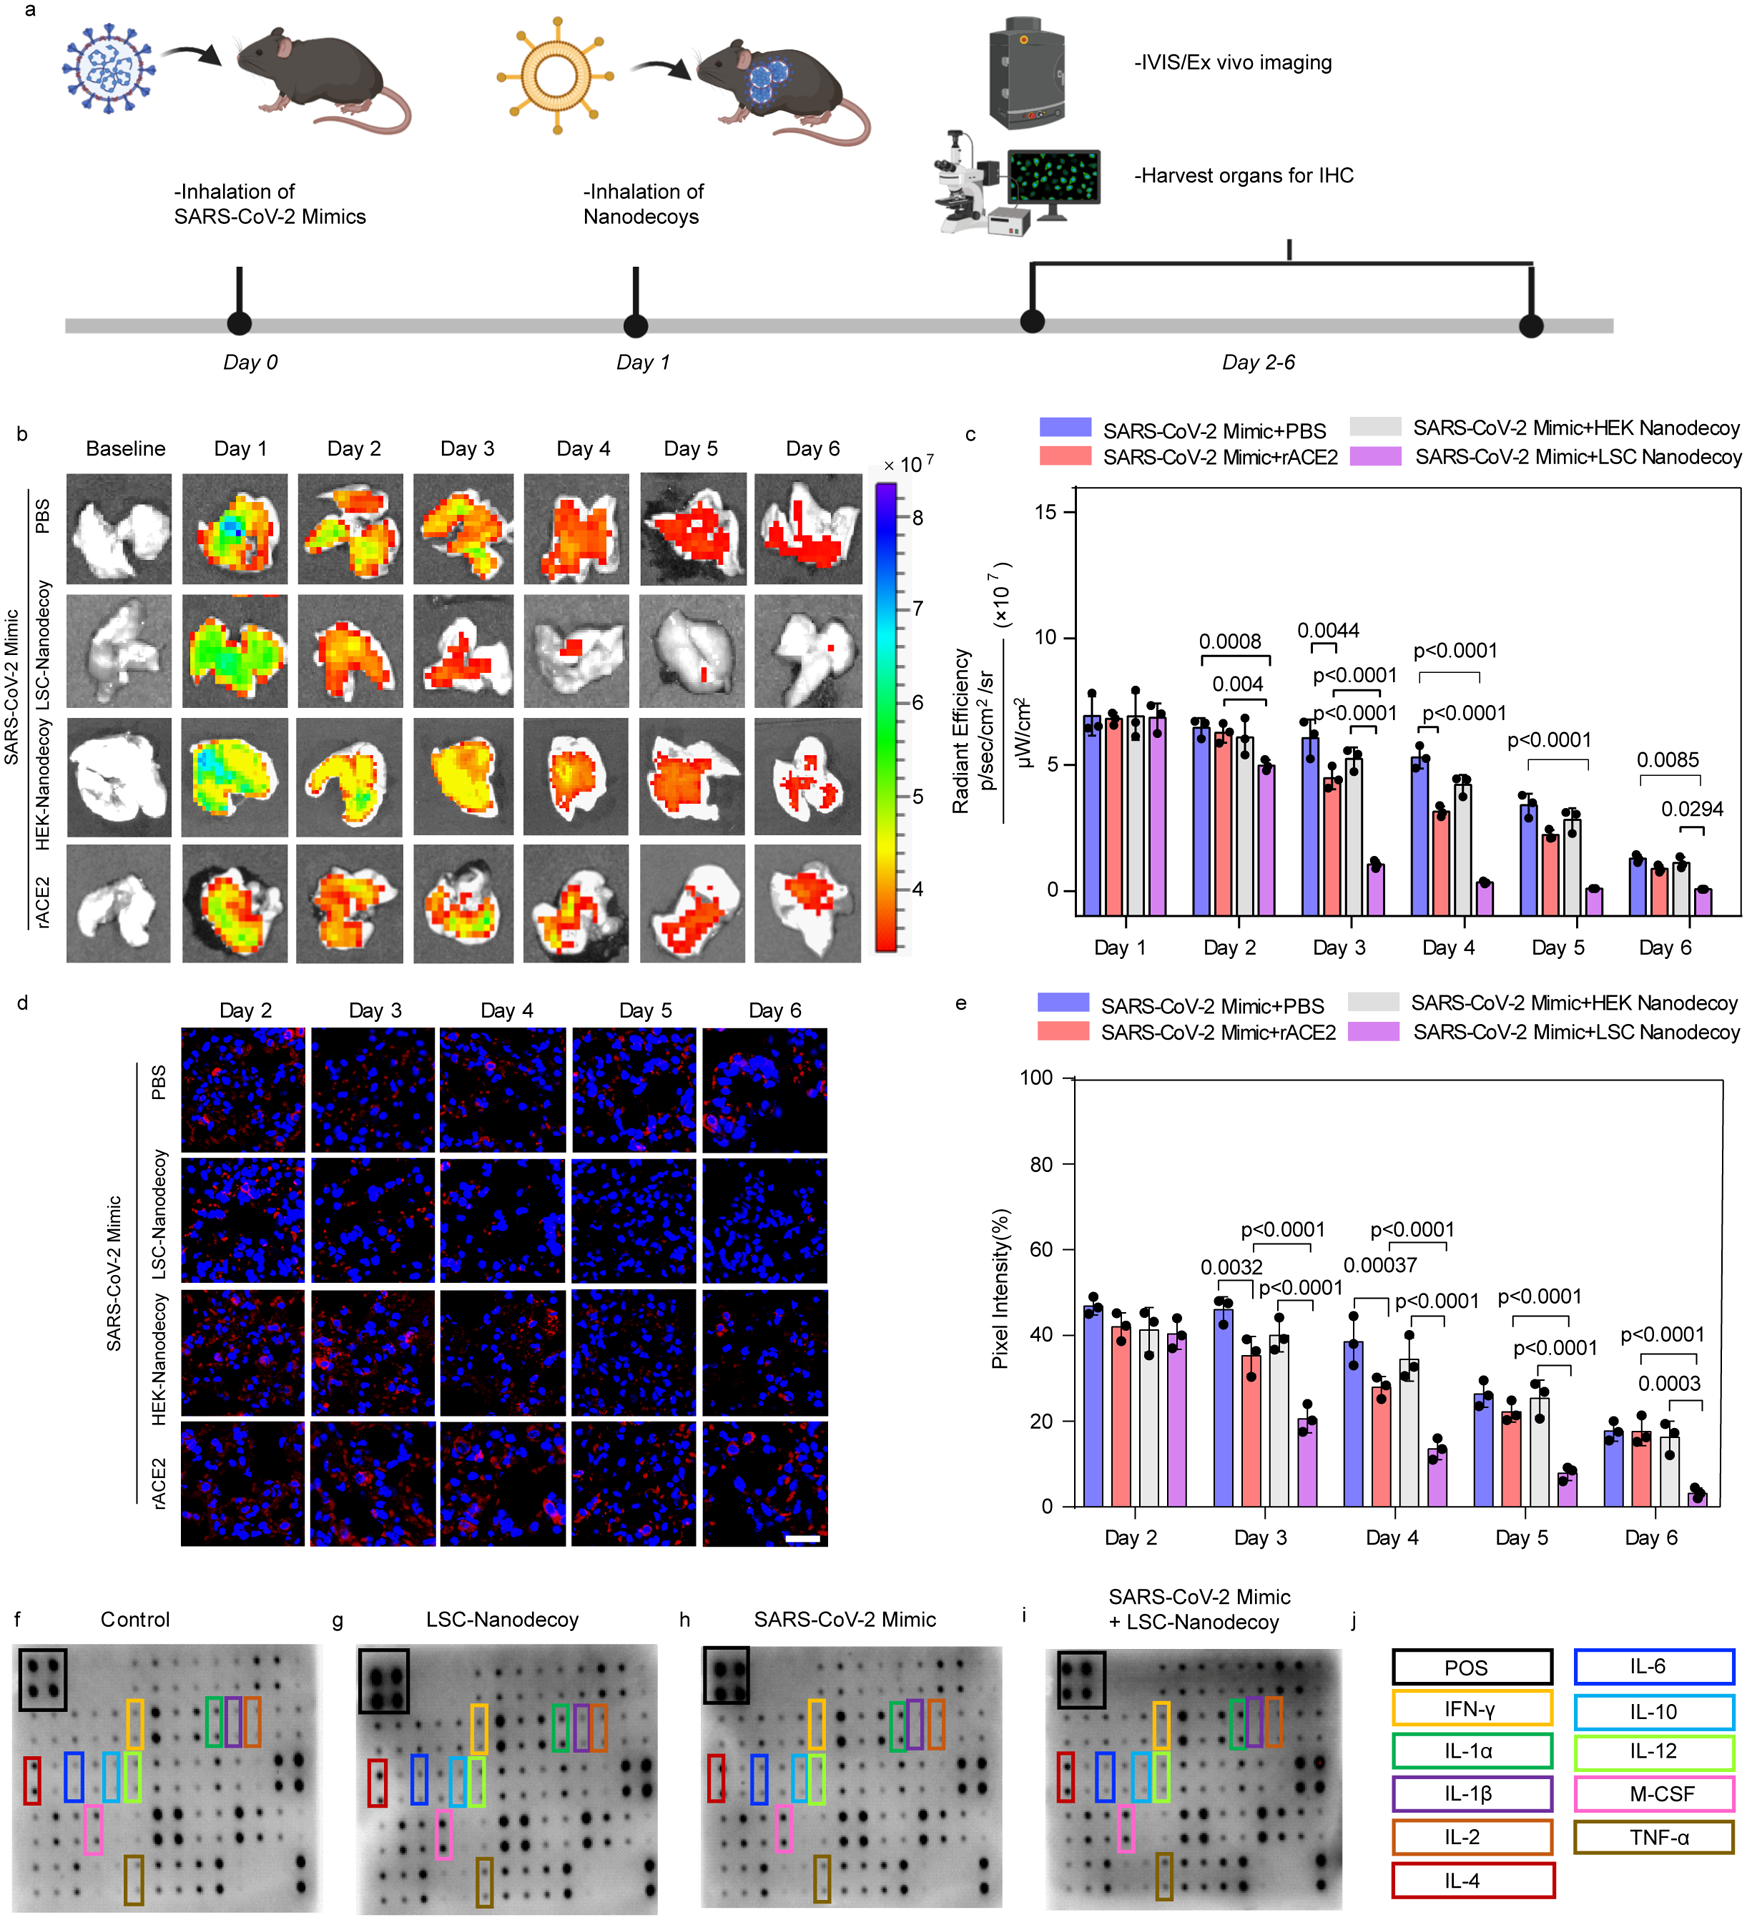
(a) Schematic showing the animal study design. Created with BioRender.com. (b) Representative ex vivo IVIS imaging of lung tissues from mice with various treatments. n=3 animals per group. (c) Quantification of fluorescence intensities of SARS-CoV-2 mimics from the imaging data in (b). Data are shown as mean ± SD, n=3 animals per group. Statistical analysis was performed by two-way ANOVA with a Tukey post hoc test for multiple comparisons. (d) Representative confocal images of AF647-labeled SARS-CoV-2 mimics (red) in lung sections. Scale bar, 50 μm. n=3 animals per group and three images were taken for each animal. (e) Corresponding semi-quantitative analysis of AF647-labeled SARS-CoV-2 mimics in lung tissues. Data are shown as mean ± SD, n=3 animals per group. Statistical analysis was performed two-way ANOVA with a Tukey post hoc test for multiple comparisons. (f-j) Cytokine array analysis of various inflammatory cytokines in the serum 3-days after treatment.