
Figure 6. LSC-nanodecoy inhalation treats SARS-CoV-2 infection in cynomolgus macaques.
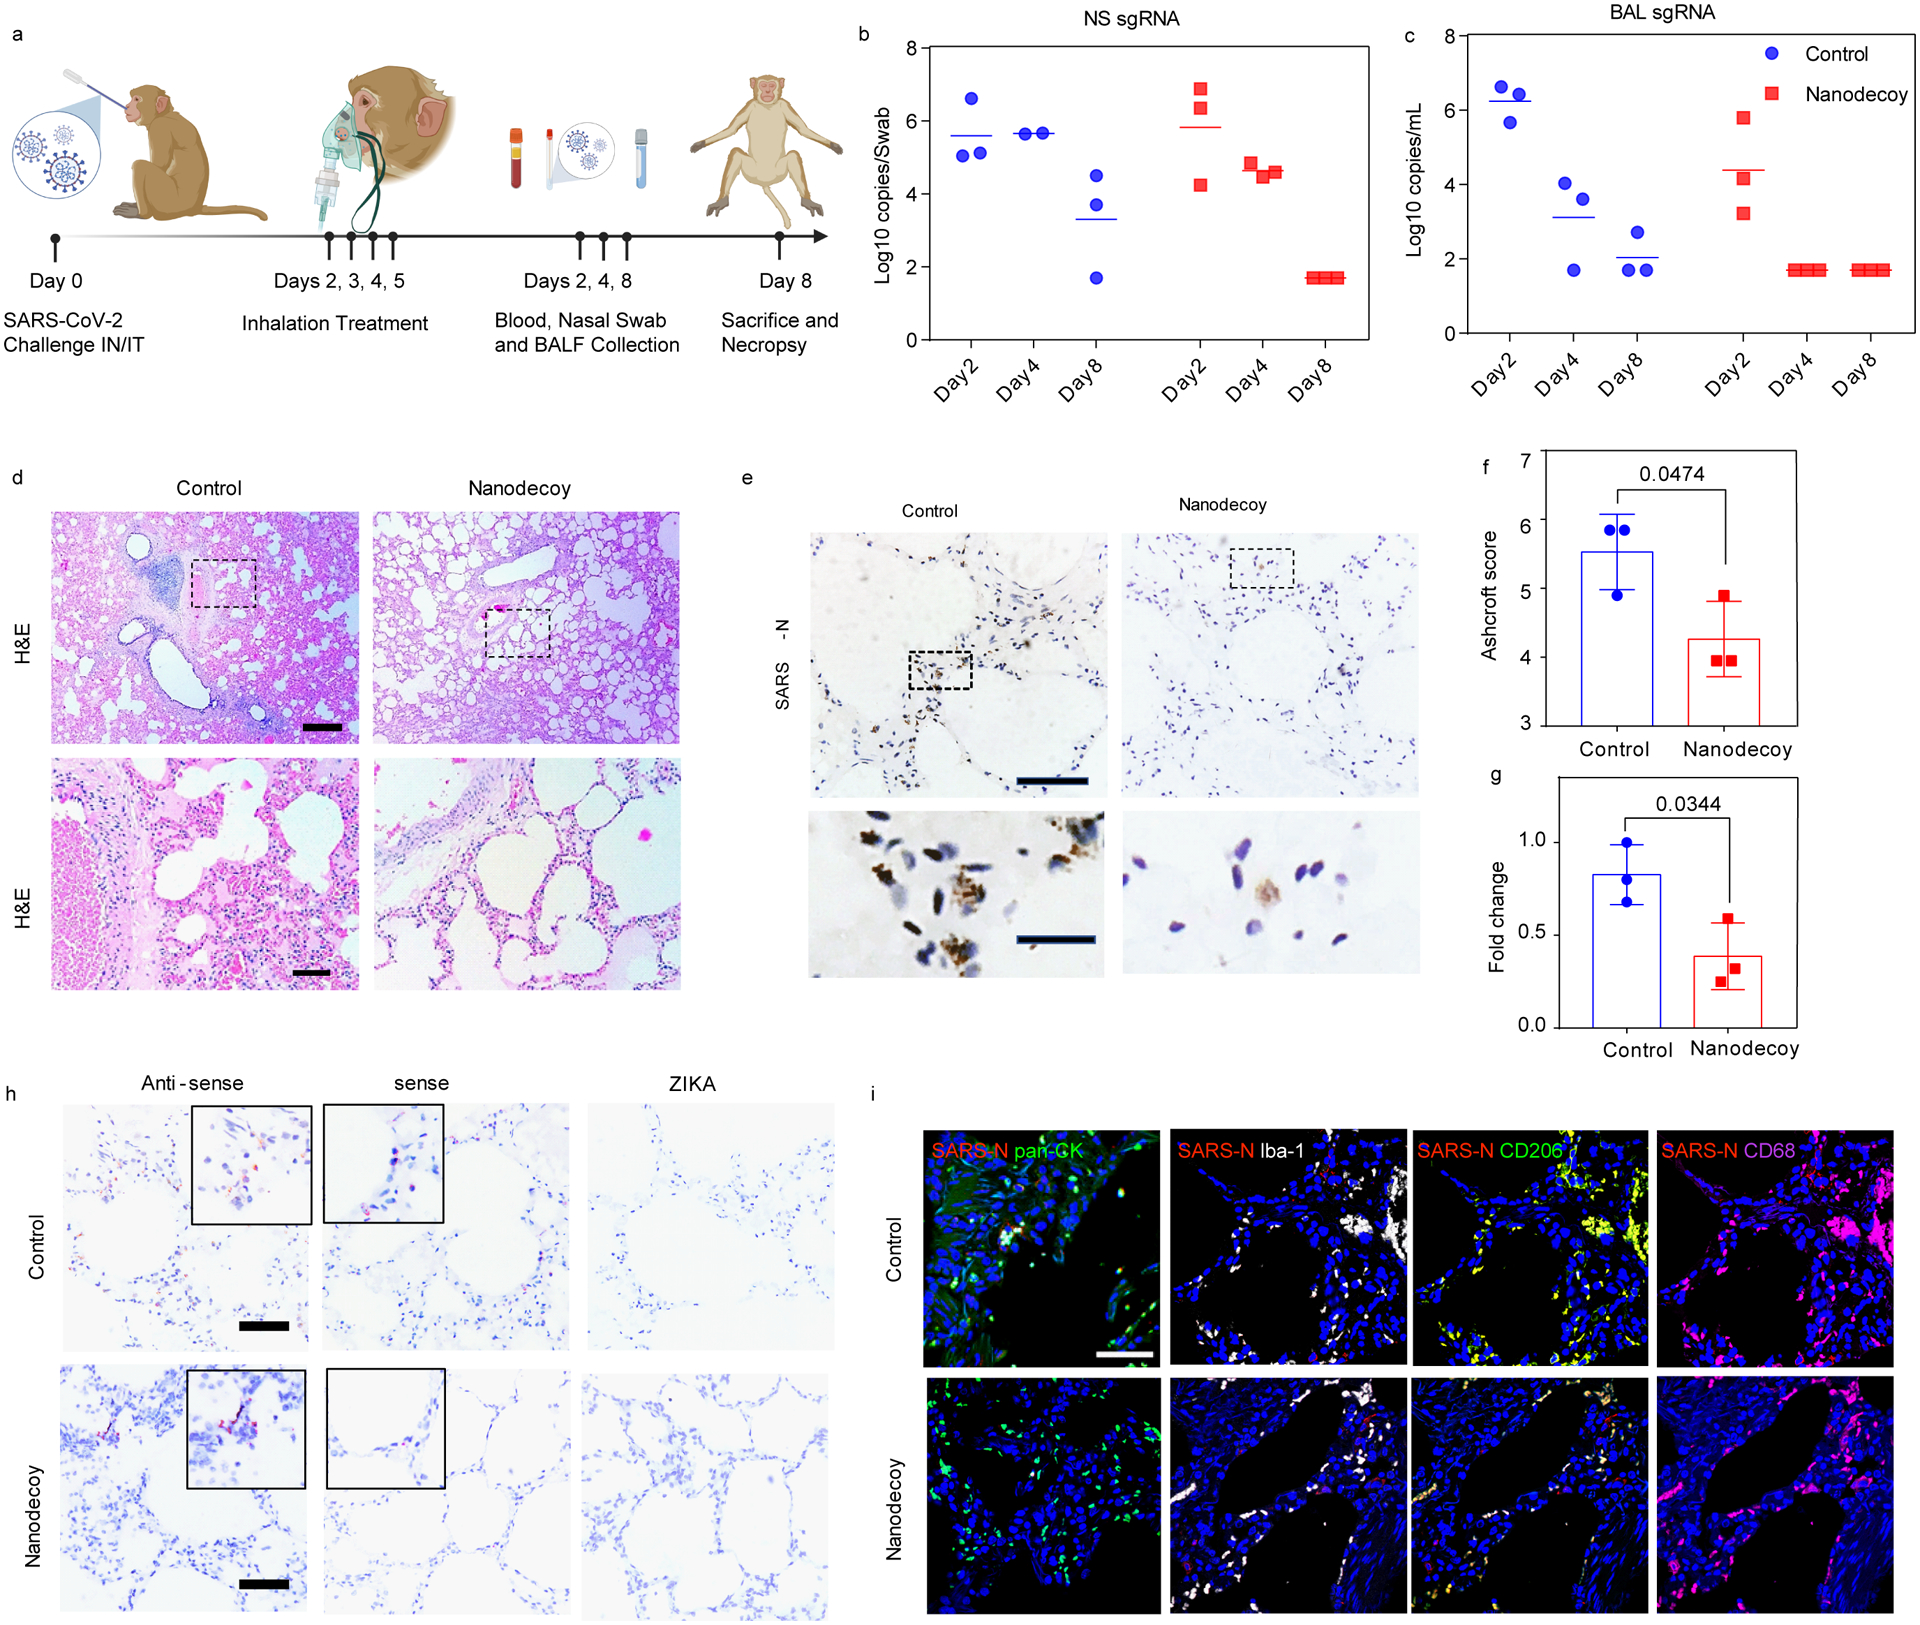
(a) Schematic depicting the cynomolgus macaque study design. Created with BioRender.com. (b and c) Viral subgenomic RNA (sgRNA) copies/Swab in nasal swabs (NS) and bronchoalveolar lavage (BAL) at various timepoints following challenge. Each dot represents data from one animal. n=3 animals per group and three images were taken for each animal. (d) Representative H&E images of fixed lung tissues from SARS-CoV-2 infected cynomolgus macaques and at least three images were taken per animal. Top: scale bar, 500 μm; bottom: scale bar, 100 μm. (e) Representative images of SARS nucleocapsid (SARS-N) immunohistochemistry (IHC) staining in fixed lung tissues from SARS-CoV-2 infected cynomolgus macaques treated with control or LSC-nanodecoys 8-days post-viral challenging. n=3 animals per group and three images were taken for each animal. Top: Scale bar, 100 μm; bottom: scale bar, 20 μm. (f) Quantification of lung fibrosis of infected cynomolgus macaques by Ashcroft scoring; each dot represents data from one animal; data are shown as mean ± SD, n = 3 animals per group. Statistical analysis was performed by two-tailed Student t-test. Ashcroft scoring was performed blindly. (g) Quantitation of positive SARS nucleocapsid numbers in lung tissues of infected cynomolgus macaques. Each dot represents data from one animal; data are shown as mean ± SD, n = 3 animals per group. Statistical analysis was performed with two-tailed Student t-test. (h) Representative images of RNAscope in situ hybridization detection of vRNA in infected cynomolgus macaques. ZIKA as a control probe. n=3 animals per group and three images were taken for each animal. Scale bar, 100 μm. (i) Representative immunofluorescence images of SARS-N (red), pan-CK (green), Ibal-1 (greyscale), CD68 (green) CD206 (magenta) and DAPI (blue). Scale bar, 50 μm. n=3 animals per group and three images were taken for each animal.