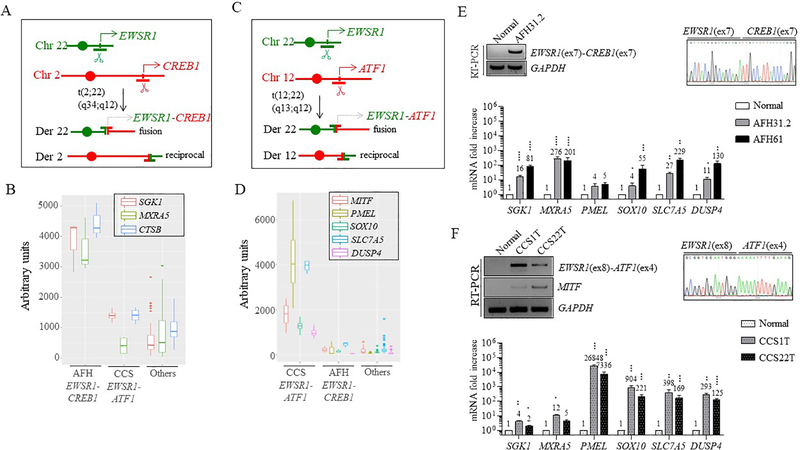
Figure 1. Gene expression signatures of human AFH and CCS.
(A) AFH is associated with the t(2;22)(q34;q12) translocation, resulting in an EWSR1-CREB1 fusion.
(B)EWSR1-CREB1 fusion-positive AFH tumors have high transcript levels of SGK1, MXRA5, and CTSB (3 cases), as compared to CCS tumors (4 cases), 44 other sarcomas (5 angiosarcoma AS, 3 fibrosarcoma FS, 5 gastrointestinal stromal tumors GIST, 11 paraganglioma CTR, 3 leiomyosarcoma LMS, 3 myxoid liposarcoma MLS, 3 undifferentiated pleomorphic sarcoma MFH, 3 synovial sarcoma SS, 4 solitary fibrous tumor SFT, 4 small blue round cell tumor SBRCT) and 6 normal tissues (testis, brain, adrenal, kidney, small intestine and fetal stomach), (“Others”).
(C) CCS is associated with t(12;22)(q13;q12) translocation, resulting in an EWSR1-ATF1 gene fusion. (D) EWSR1-ATF1 fusion-positive CCS tumors (4 cases) have high transcript levels of several genes, in particular, PMEL and SLC7A5, as compared to AFH tumors and other sarcomas and normal tissues (same as in panel B).
(E) Two additional EWSR1-CREB1 fusion-positive AFH (AFH31.2 and AFH61) samples show high mRNA levels of SGK1, MXRA5, SLC7A5 and DUSP4 and to a lesser extent, SOX10, as compared with normal tissue. CTSB is also high in these two tumors, but it is not present in normal tissue. RT-PCR and Sanger sequencing showing the EWSR1(ex7)-CREB1(ex7) fusion in AFH31.2 is also included.
(F) Two additional EWSR1-ATF1 fusion-positive CCS (1T and 22T) cases revealed similarly high levels of expression in the genes shown in (D). RT-PCR and Sanger sequencing showing the in frame EWSR1(ex8)-ATF1(ex4) fusion and MITF expression in these two tumors, but not in normal tissue.
Numerical values indicate fold increase compared to normal tissue. Error bars in this figure represent standard deviation from the mean of at least three technical replicates. Statistical significance is calculated by comparison of tumor samples with normal tissue. *p<0.05; **p<0.01; ***p<0.001; ****p<0.0001 (paired t-test).

