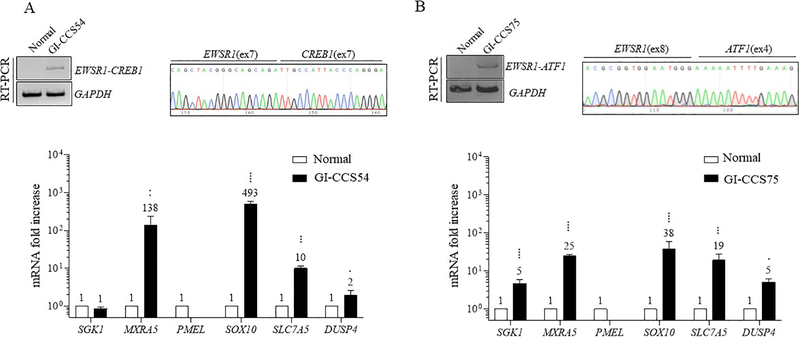
Figure 2. Gene expression signature of GI-CCS tumors expressing EWSR1-CREB1 and EWSR1-ATF1 fusions.
(A) An EWSR1-CREB1 fusion-positive GI-CCS (GI-CCS54) demonstrates upregulation of MXRA5, SOX10 and SLC7A5, and to lesser extent DUSP4, but not SGK1. RT-PCR and Sanger sequencing show the in-frame EWSR1(ex7)-CREB1(ex7) fusion.
(B) An EWSR1-ATF1 fusion-positive GI-CCS (GI-CCS75) also demonstrates high levels of the genes shown in (A), as well as SGK1. RT-PCR and Sanger sequencing show the in-frame EWSR1(ex8)-ATF1(ex4) fusion. Numerical values indicate fold increase compared to normal tissue. Statistical analysis same as in Fig. 1. Fold increase values for PMEL are ≤1 (0.074 and 0.17 respectively).

