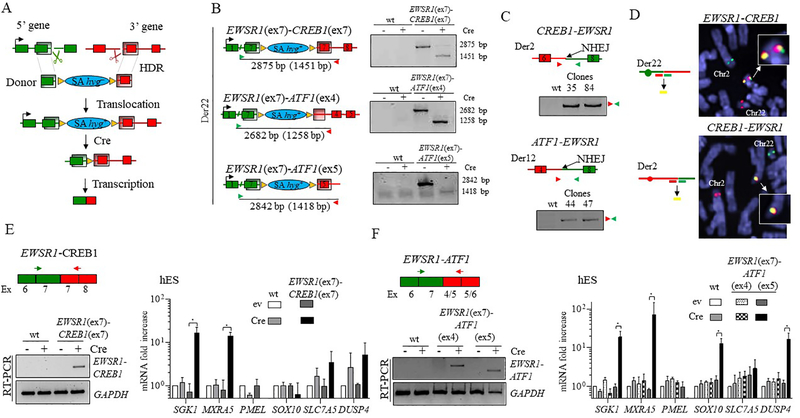
Figure 3. Generation and expression of EWSR1-CREB1 and EWSR1-ATF1 fusions in hES cells.
(A) Chromosomal translocation strategy for conditional fusion gene expression. A donor template containing a promoter-less selectable marker hygromycin (hyg–) and two homology arms (shaded regions) is inserted by HDR at the gRNA-mediated DSBs (scissors) at the chromosomal locations of the 5’ and 3’ fusion partners. An in-frame splice acceptor (SA) sequence upstream of hyg– allows expression of the gene upon correct integration of the donor (hyg+), allowing selection in hygromycin. Transcription of the fusion gene is dependent on removal of the selectable marker by Cre recombinase.
(B) Fusion genes are formed upon Cre expression. Left, Schematic representation of the three translocations prior to Cre expression, with the size of the PCR products across the breakpoint junctions before and after (in parenthesis) removal of hyg+. Right, a PCR size shift confirms the formation of the direct fusion for each of the translocations.
(C) The reciprocal translocations confirmed by PCR analysis in the clones harboring the EWSR1(ex7)-CREB1(ex7) and EWSR1(ex7)-ATF1(ex5) translocations.
(D) Dual color FISH analysis showing the EWSR1 and CREB1 loci and the resulting derivative chromosomes, Der 22 (top) and Der 2 (bottom), using the indicated “split” probes (i.e., two for each gene). Note that in the top image, the EWSR1 and CREB1 probes do not match the chromosome coloring scheme). Unrearranged chromosomes 2 and 22 are also indicated.
(E) Induction of the EWSR1(ex7)-CREB1(ex7) fusion after Cre expression in hES cells results in upregulation of SGK1 and MXRA5 (ev, empty vector). Histogram represents the mean fold increase compared to empty vector condition of wild type cells as measured by ΔΔCt method and error bars indicate the standard deviation from the mean of 3 independent experiments. Statistical significance is calculated with a paired t-test comparing Cre condition with the corresponding control (ev). *p<0.05; when not indicated, the difference is considered not statistically significant.
(F) Induction of the EWSR1(ex7)-ATF1(ex5) fusion, but not the EWSR1(ex7)-ATF1(ex4), after Cre expression in hES cells results in upregulation of GI-CCS core signature genes, SGK1, MXRA5, SOX10, and DUSP4 (ev, empty vector). Statistical analysis as in panel E, n=3.

