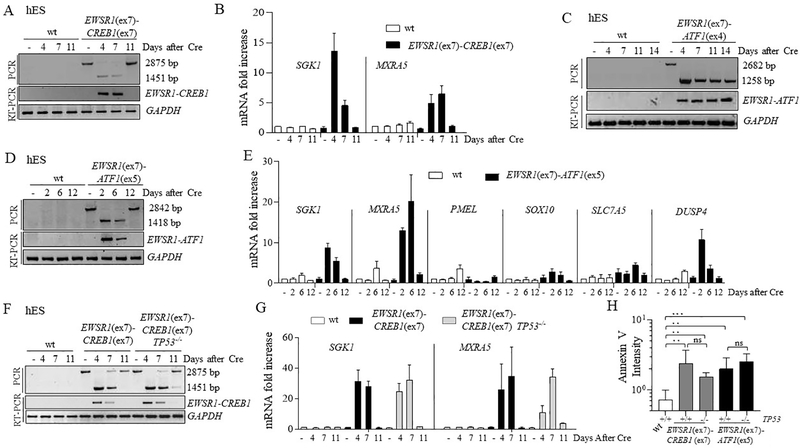
Figure 4. Impaired proliferation of hES cells upon EWSR1(ex7)-CREB1(ex7) or EWSR1(ex7)-ATF1(ex5) fusion expression.
(A) Time course of the EWSR1(ex7)-CREB1(ex7) fusion after Cre expression. The fusion was analyzed using both PCR of genomic DNA and RT-PCR. The lower band in the PCR is the direct fusion, while the upper band indicates that the fusion partners are separated by the hyg+ gene. See Fig. 3B.
(B) Time course for expression of AFH signature genes SGK1 and MXRA5 using qRT-PCR upon EWSR1(ex7)-CREB1(ex7) fusion in sorted cells. Histogram represents the fold increase compared to wild type cells (-Cre condition) of 1 representative experiment (n=3).
(C) Same as panel A for the EWSR1(ex7)-ATF1(ex4) fusion.
(D) Same as panel A for the EWSR1(ex7)-ATF1(ex5) fusion.
(E) Time course for expression analysis using qRT-PCR upon EWSR1(ex7)-ATF1(ex5) fusion in pooled cells. Histogram represents the mean of fold increase compared to wild type cells (-Cre conditions) of 2 independent experiments.
(F) Same as panel A for the EWSR1(ex7)-CREB1(ex7) fusion with, in addition, TP53−/− cells.
(G) Time course for expression of AFH signature genes using qRT-PCR upon EWSR1(ex7)-CREB1(ex7) fusion induction in wild-type and TP53−/− background. Histogram represents the fold increase to wild type of 1 representative experiment (n=3).
(H) Quantification of Annexin V staining for measurement of apoptosis. Annexin V intensity is represented as the ratio of the percentages of Cre and empty vector-transfected cells. Error bars represent standard deviation from the mean of n≥3 independent experiments. Unpaired t-test, *p<0.05, **p<0.01, ***p<0.001, ns=not significant.

