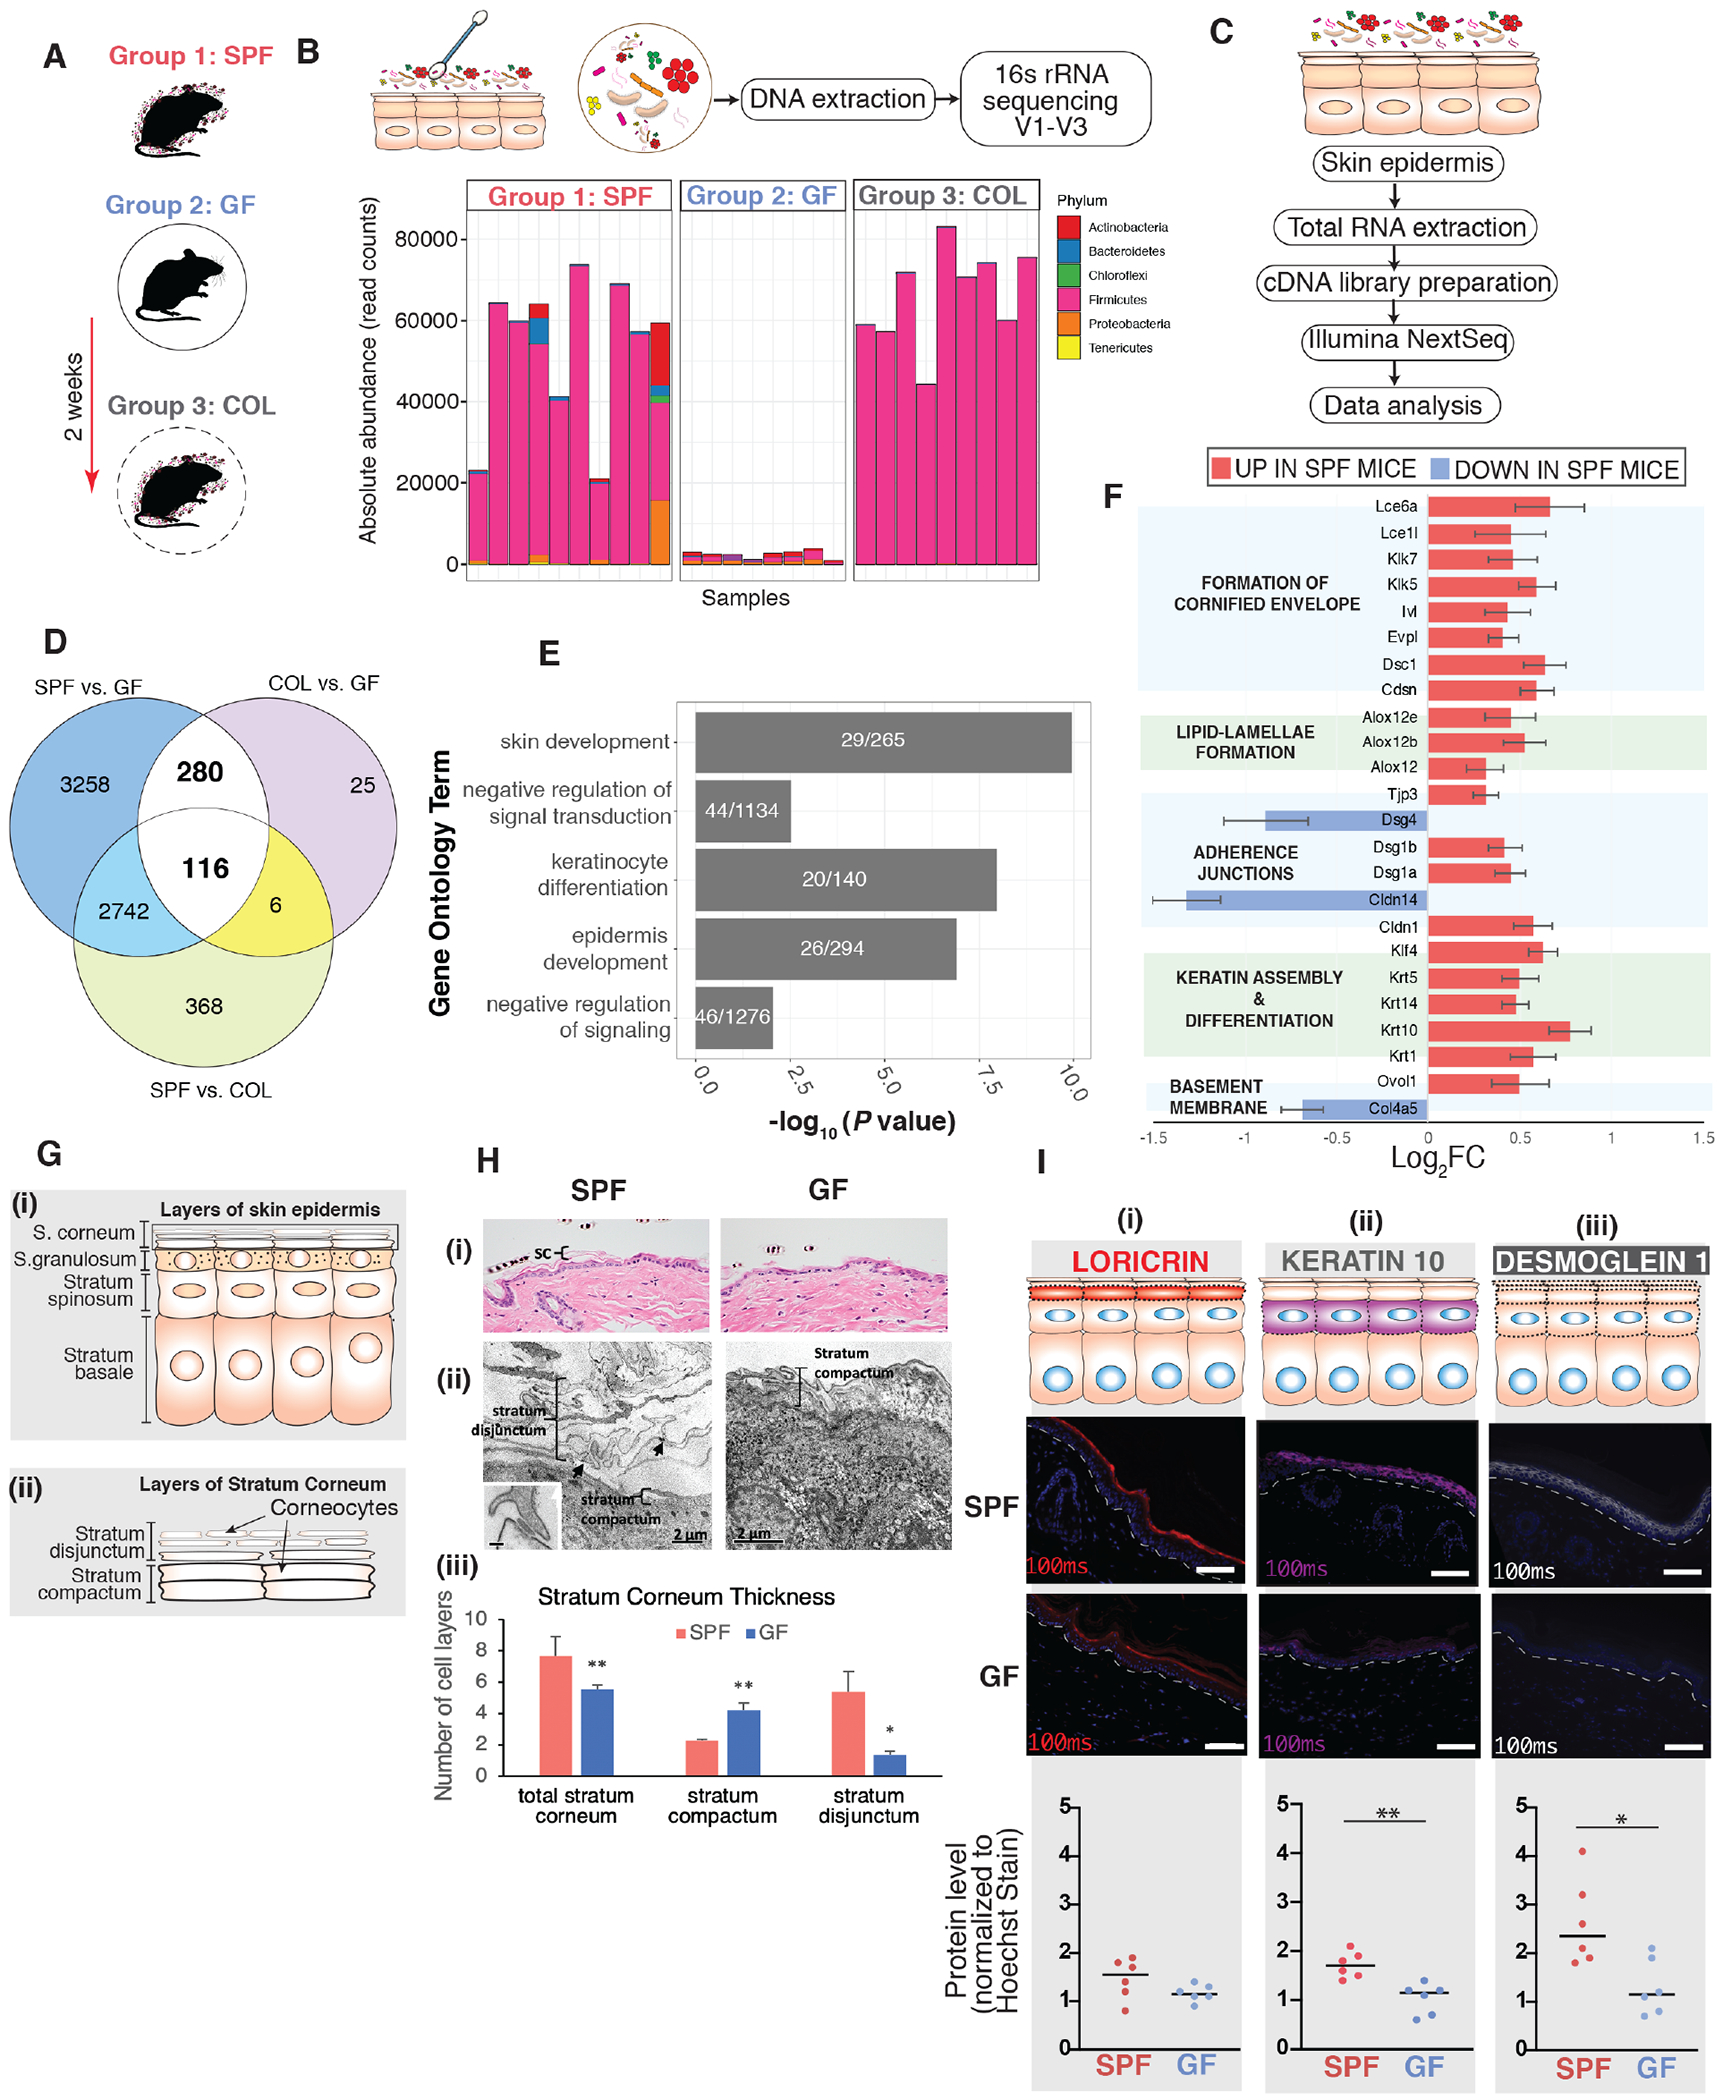
Figure 1. Commensal microbiota regulates epithelial barrier genes.

(A) Three groups of mice were employed, specific pathogen free (SPF), germ free (GF), and germ-free mice colonized (COL) with SPF microbiota for 2 weeks [n=8 mice (4 female,4 male)/group]. (B) Skin microbiota composition determined by 16S rRNA gene sequencing. Y-axis indicates absolute read counts of most abundant phylum (by relative abundance in the dataset) for each mouse (x-axis). (C) RNA-seq workflow. (D) Overlap of differentially expressed genes when comparing groups of gnotobiotic mice. (E) Shown in white are the number of genes that were further analyzed for uniquely enriched gene ontology biological process terms for aforementioned DEGs. Shown on the y-axis are the uniquely enriched terms, with p-values indicated on the x-axis. P-values are based on Fisher’s exact test and FDR-adjusted under dependency using the “BY” method. (F) Genes involved in different facets of epithelial barrier. Shown are genes that were differentially expressed in the SPF vs GF subset (p<0.001). Horizontal bars represent the Log2 fold-change comparison (genes upregulated in SPF: log2FC> 0, downregulated in SPF: log2FC < 0). Error bars represent standard error estimate for the log2 fold-change. (G) Schematic depicting layers of (i) skin epidermis and (ii) stratum corneum to aid understanding of histopathological and ultrastructural analyses in panel H. (H) Structural analysis of dorsal skin from age-matched GF and SPF mice. Light microscopy of (i) Hematoxylin and Eosin and (ii) Electron microscopy (EM) of reduced osmium tetroxide-stained tissue. Black arrows indicate connections between peripheral ends of corneocytes. Inset (scale bar=100nm) shows a corneodesmosome attaching the ends of two corneocytes. In Panels (i-ii): SC = stratum corneum; C = corneocyte; CD = corneodesmosome (iii) Quantification of the number of cell layers in the stratum corneum depicted in panel (ii) (* p<0.05; ** p< 0.01; T-test). (I) Tail-skin from SPF and GF mice. Immunofluorescence-based detection of differentiation markers (i) loricrin (red) and (ii) keratin-10 (purple) and adhesion marker (iii) desmoglein-l(grey). Nuclei are counter-stained with Hoechst stain (blue). White dashed-line indicates boundary separating epithelial-stromal compartments. Scale bar (10μm) is indicated in white (bottom-right). Images were taken (n=6 mice) at constant light exposure and integrated density of signal was normalized to Hoechst signal. Each dot corresponds to average normalized signal across 10-12 random images for each mouse. Asterisk indicates statistical significance (p<0.05, T test, two-sided). See also Table S1, S2, S3, and Figure S1.
