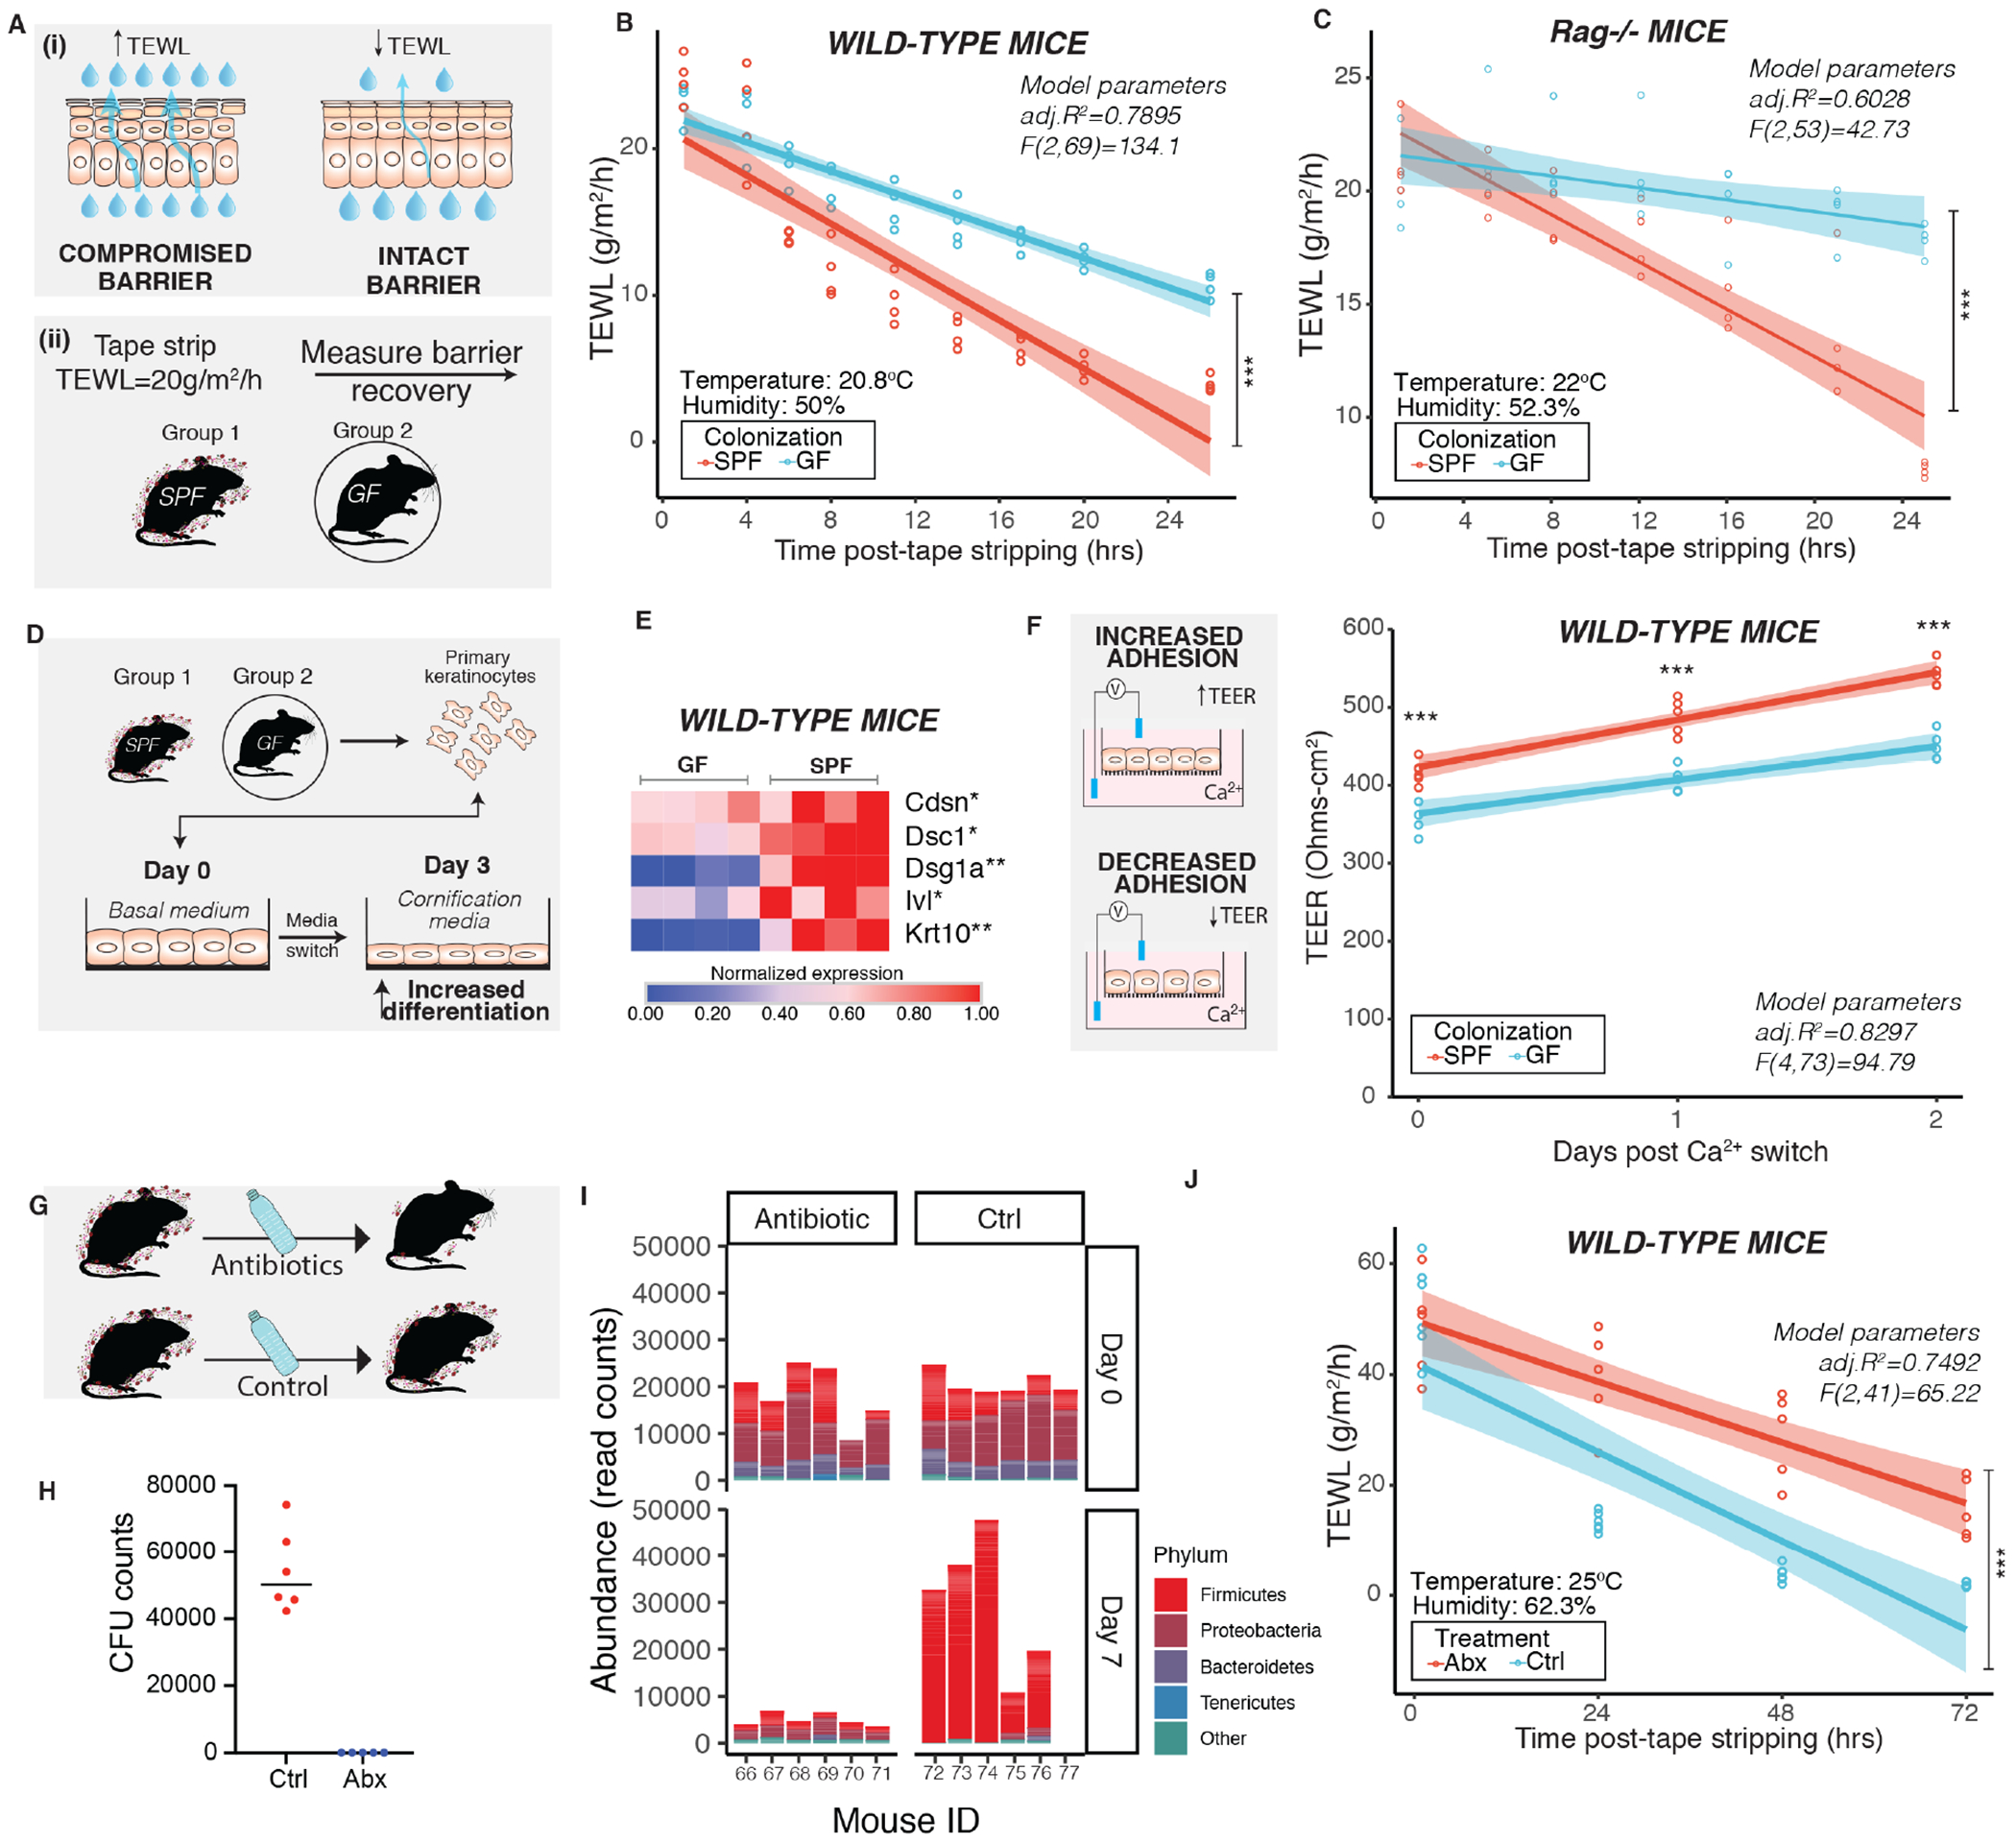
Figure 2. Commensal microbiota promotes skin barrier repair function.

(A) Schematic depicts (i) principle of measuring transepidermal water loss (TEWL) to assess barrier repair function in adult mice (6-8 weeks old) and (ii) experimental design for assessing barrier recovery. Effect of colonization of microbes was assessed by comparing age-matched germ-free (GF) and specific pathogen-free (SPF) mice (n=4 male mice per group) in (B) wild-type C57/BL6 mice [ANCOVA, F (1,69) =50.649, ***P<0.001)] and (C) Rag1−/− mice [ANCOVA, F (1,53) =188.1, ***P<0.001)]. (D) Primary mouse keratinocytes derived from wild-type GF (n=4) and SPF (n=4) C57/BL6 mice were terminally differentiated. (E) Expression of genes involved in differentiation and adherence were assessed by qRT-PCR. Each square represents average readings from keratinocytes (n= 4 technical replicates) derived from an individual mouse (n=4 mice per group). *P<0.01, ** P<0.001 by T-test adjusted by Bonferroni correction. (F) Primary keratinocytes were grown on transwells. Epithelial adhesion was assessed by measuring transepithelial electrical resistance (TEER) at indicated time points. Data from one experiment is represented for visualization (See Figure S2). One dot represents average TEER readings from technical replicates (n=3) derived from one individual mouse (n=4 mice per group). ***P<0.001 by two-way ANOVA adjusted for multiple experiments. (G) To decrease skin microbial burden, wild-type SPF mice were treated with antibiotic cocktail (n=5 male mice/group) or vehicle (n=6 male mice/group) for two weeks. (H) Mice were swabbed 14 days after treatment and colony forming units (CFU) were determined. (I) Genomic DNA was extracted from swabs collected at baseline (Day 0) and after one week of treatment (Day 7). The V1-V3 region of the 16S rRNA gene was sequenced and analyzed. Shown is abundance of read counts classified to different phyla in each sample. Phyla with total read count <1000 are grouped into ‘Other’. (See Figure S3) (J) At the end of two weeks mice were tape stripped and TEWL was measured and plotted against time [ANCOVA, F (1,41) =26.315, ***P<0.001)]. TEWL vs time readings were fitted by linear modeling (in B, C, F and J) and significance was assessed by ANCOVA. Modeling parameters (adjusted R2 and F-statistics) are indicated on top-right for each plot. Span (shaded area) represents 95% Cl. Temperature and humidity conditions during TEWL measurement are indicated for each experiment. Also see Figures S2 and S3.
