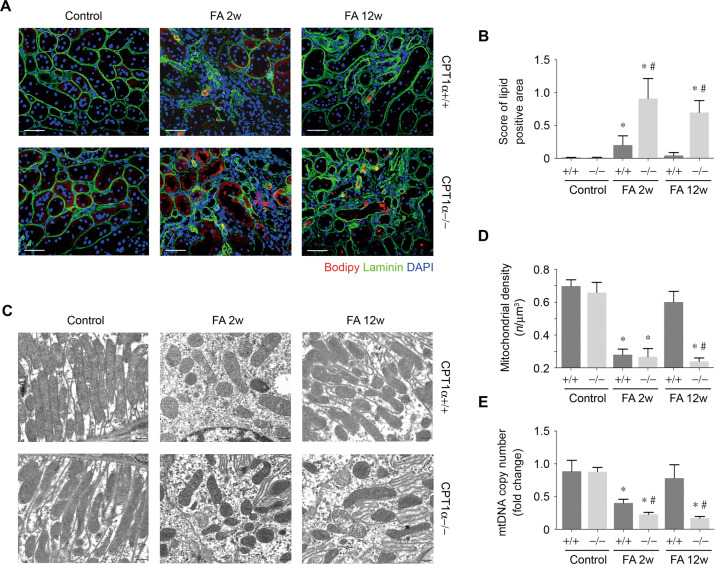
Fig. 5. CPT1α deficiency promotes lipid accumulation and mitochondrial mass reduction.
A Representative images of kidney samples stained with bodipy. Red, bodipy. Green, laminin. Blue, nuclei. Scale bar, 50 μm. B Quantification of lipid positive area in kidney samples obtained from groups as indicated. n = 6 for each group. C Representative TEM of the ultrastructure of mouse kidney tubular cells obtained from resin-embedded kidney sections from groups as indicated. Scale bars: 500 nm. D Quantification of mean mitochondria per volume (n/μm3) by morphometric analysis. n = 6 for each group. E mtDNA copy number was determined in kidneys from groups as indicated. Bar graphs represent the mean ± SEM of fold changes. n = 6 for each group. * P < 0.05 versus control. # P < 0.05 versus CPT1α+/+.

