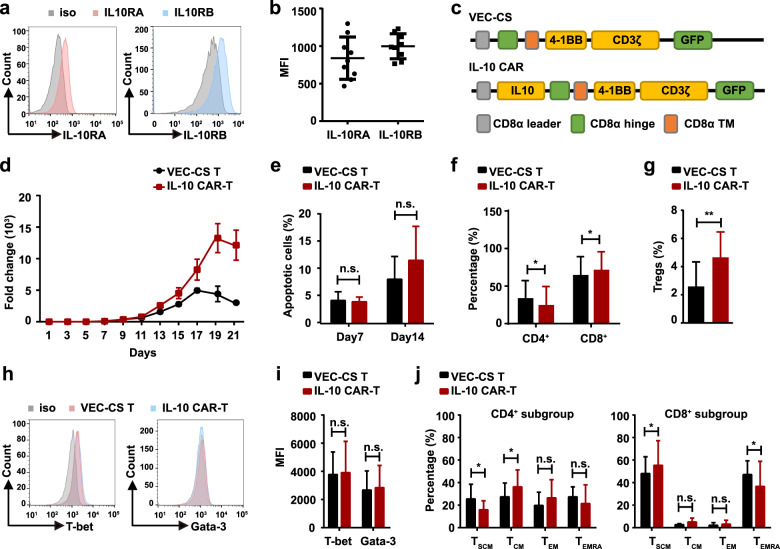
Fig. 6. The effects of IL-10 on the survival, phenotype, and biological activity of IL-10 CAR-T cells.
Representative flow cytometry analysis of the expression of IL-10RA (left panel) and IL-10RB (right panel) on T cells. b Quantification and statistical analysis of the MFI in (a) (n = 9). c Schematic diagram of the VEC-CS and IL-10 CAR constructs. d The proliferation of VEC-CS T or IL-10 CAR-T cells cultured for 21 days (n = 3). e Quantification of the apoptosis of VEC-CS T or IL-10 CAR-T cells at day 7 and day 14 (n = 3; two-way ANOWA; n.s. no significant). f Quantification and statistical analysis of the proportion of CD4+ or CD8+ T cells at day 14 (n = 9; *p < 0.05). g Quantification and statistical analysis of the proportion of CD4+ CD25+ FOXP3+ Tregs at day 7 (n = 5; **p < 0.01). h Representative flow cytometry analysis showing the expression of T-bet (left panel) and GATA-3 (right panel) on T cells. i Quantification and statistical analysis of the MFI in (h) (n = 3; n.s. no significant). j Quantification and statistical analysis of the proportion of TSCM (CD45RA+ CCR7+), TCM (CD45RA+ CCR7−), TEM (CD45RA− CCR7+), and TEMRA (CD45RA+ CCR7−) subgroups in VEC-CS T or IL-10 CAR-T cells. CD4+ T cell analysis was shown in the left panel, and CD8+ T cell analysis was shown in the right panel (n = 9; two-way ANOWA; n.s. no significant; *p < 0.05).

