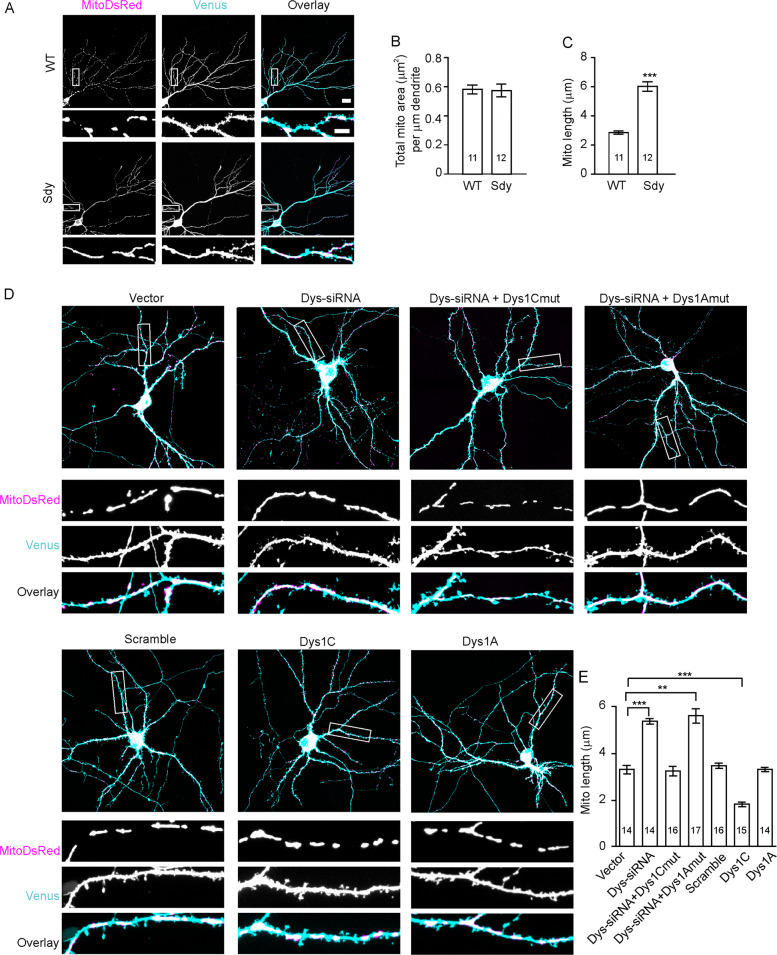
Fig. 1. Dysbindin-1 controls mitochondrial length.
Hippocampal slices cultured from sdy mice and their WT littermates (A–C) or cultured WT hippocampal neurons (D, E), were used for confocal imaging of mitochondria. A Representative images of mitochondria in the CA3 region; scale bar, 10 μm. B, C Quantification for A; Mann–Whitney U test (B) and Student’s t-test (C) were used; n in the bars indicates the number of brain slices from four WT and five sdy mice. D Representative images of transfected neurons; scale bar, 20 μm for upper and 5 μm for lower, enlarged images. E Quantification for D; one-way ANOVA on ranks was used to compare across groups (H = 82.78, DF = 6, p < 0.001); Student’s t-test was used for vector vs. Dys-siRNA, vector vs. Dys-siRNA + Dys1Cmut, vector vs. Dys-siRNA + Dys1Amut; Mann–Whitney U test was for vector vs. scrambled, vector vs. Dys1C, vector vs. Dys1A; n in the bars indicates the number of neurons. Data are presented as mean ± SEM. **p < 0.01, ***p < 0.001.

