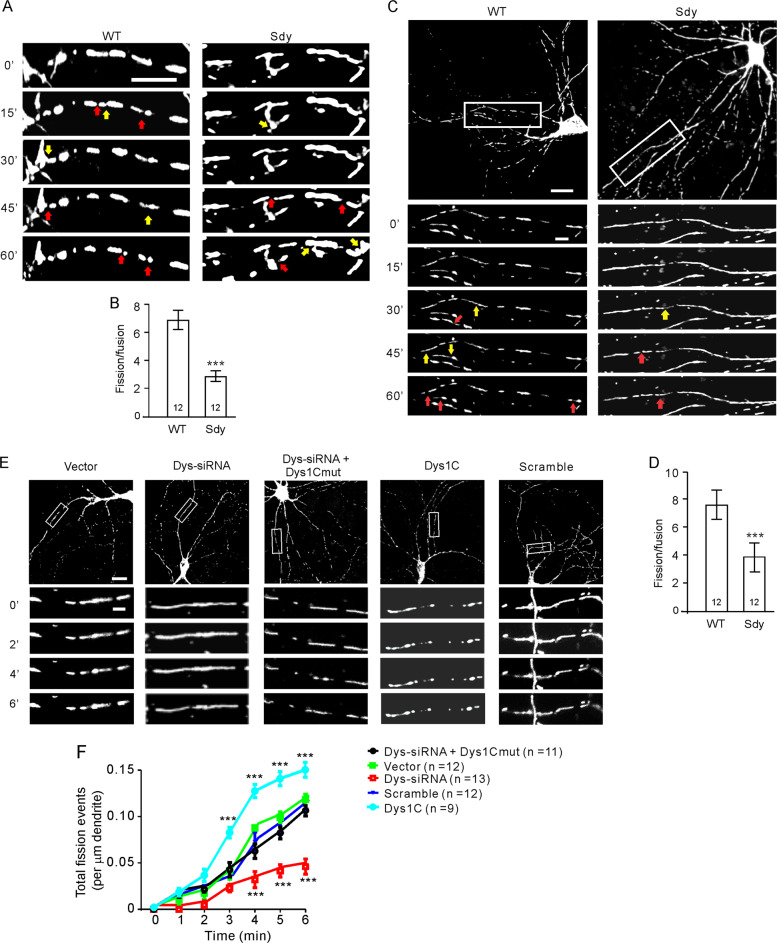
Fig. 2. Mitochondrial fission is impaired in dysbindin-1 deficient neurons.
Hippocampal slices cultured from sdy mice and their WT littermates (A, B) or cultured hippocampal neurons (C–F) were used for time-lapse imaging of mitochondria. A Representative time-lapse images of mitochondria in the CA3 region; scale bar, 5 μm. B Quantification for A; the fission and fusion rates were defined as the number of fission or fusion events identified within 10 μm dendrite per min; Mann–Whitney U test was used for statistical analysis; n in the bars indicates the number of brain slices from four animals. C Representative time-lapse images of mitochondria in primary WT and sdy hippocampal neurons; scale bar, 20 μm for upper and 5 μm for lower, enlarged images. D Quantification for C; Mann–Whitney U test was used for statistical analysis; n in the bars indicates the number of neurons. E Representative images of mitochondria in transfected neurons at designated time points after photostimulation; scale bar, 20 μm for upper and 5 μm for lower, enlarged images. F Quantification of the number of total fission events identified within 10 μm dendritic segments after photostimulation for E; two-way RM ANOVA was used to test for the influence of treatment on fission, p < 0.001; Holm-Sidak test was used for comparisons of Dys-siRNA vs. vector, vector vs. scrambled, Dys-siRNA + Dys1cmut vs. vector; Mann–Whitney U test was used to compare Dys-siRNA vs. vector and Dys1C vs. vector at different time points; n = 13 neurons for Dys-siRNA, 12 neurons for vector, 12 neurons for scrambled siRNAs, and 11 neurons Dys-siRNA + Dys1cmut. Mitochondrial fission sites were indicated by red arrows and mitochondrial fusion sites with yellow arrows in A, C. Data are presented as mean ± SEM; ***p < 0.001. (color figure online).

