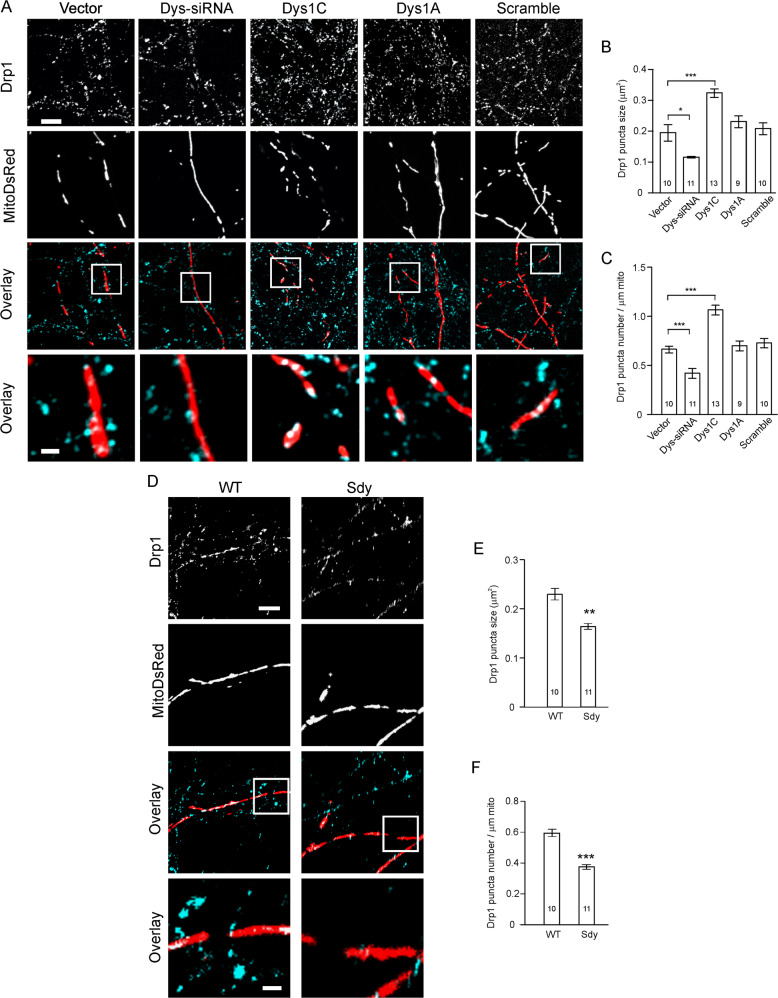
Fig. 3. Dysbindin-1 promotes Drp1 accumulation on mitochondria.
Cultured hippocampal neurons were transfected with designated plasmids and stained for Drp1. A, D Representative images; scale bar, 5 μm in A and D for low-magnification images, 1 μm in A and D for high-magnification images. B, C Quantification for Drp1 puncta on mitochondria for A; B one-way ANOVA on ranks was used to compare across groups (H = 34.444, DF = 4, p < 0.001), Mann–Whitney U test was used to compare vector vs. Dys-siRNA, Student’s t-test was used to compare vector vs. Dys1C, vector vs. Dys1A and vector vs. scrambled; C one-way ANOVA was used to compare across groups [F(4, 48) = 30.022, p = 0.001], and Student’s t-test was used for comparison between two conditions. E, F Quantification for Drp1 puncta on mitochondria in D; Mann–Whitney U test was used for statistical analysis. 2–4 dendritic segments of 5–10 μm long in each cell were measured; n in the bar indicates the number of cells. Data are presented as mean ± SEM; *p < 0.05, **p < 0.01, ***p < 0.001.

