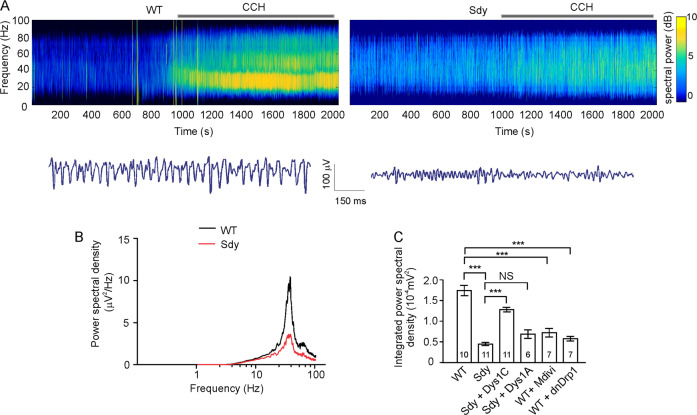
Fig. 5. Gamma oscillations are impaired in the hippocampal CA3 region of sdy slices.
Hippocampal slices were prepared from sdy mice and their WT littermates for recordings in the CA3 area. A Sample power spectrogram (top) and voltage traces after CCH treatment (bottom); 20 μM CCH was added to the bath at 10 min after baseline recordings. B Mean power spectral density of LFPs. C Integrated power spectral density of LFPs at 20–80 Hz recorded from the CA3 region from WT mice and their sdy littermates injected with designated lentivirus in the CA3 region; 20 μM CCH was added to the bath at 10 min after baseline recording; slices treated with Mdivi-1 were perfused with 100 μM Mdivi-1 at 10 min before recording and throughout the experimental period; one-way ANOVA was used to compare across groups [F(5, 46) = 39.980, p = 0.001]; Mann–Whitney U test was used to compare WT vs. sdy and sdy vs. Dys1A; Student’s t-test was used to compare sdy vs. Dys1C, WT vs. Mdivi-1 and WT vs. dnDrp1; n in the bars indicates the number of brain slices from four animals. Data are presented as mean ± SEM; ***p < 0.001.

