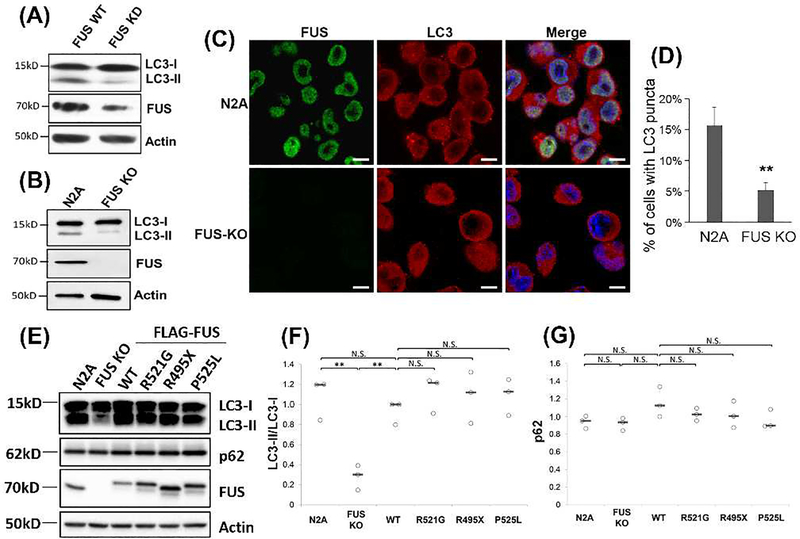
Figure 2. Loss of FUS reduced the basal level of autophagy.
(A) N2A cells were transfected with FUS siRNA using Lipofectamine™ RNAiMAX. 48h after transfection cells were harvested and immunoblotting was performed using the indicated antibodies. (B) N2A and FUS KO cells were cultured and immunoblotting was performed using the indicated antibodies. (C) Confocal imaging of FUS and LC3 in N2A and FUS KO cells. Scale bars are 10 μm. (D) Quantification of the percentage of cells containing LC3-positive autophagosomes from multiple random viewfields (N > 150 cells). **, p ≤0.01. (E) FUS KO cells were transfected with FLAG-tagged WT FUS, FUS-R495X, R521G, P525L. WT N2A cells and FUS KO cells with no transfection were included as positive and negative controls. 48h after transfections cells were collected and immunoblotting was performed with the indicated antibodies. (F-G) Quantification of (E) from three independent experiments. Results are shown in scatter plots with the bar representing the median. Student’s t-test was performed for individual comparisons against FLAG-FUS WT. **, p ≤0.01. N.S., no significance.

