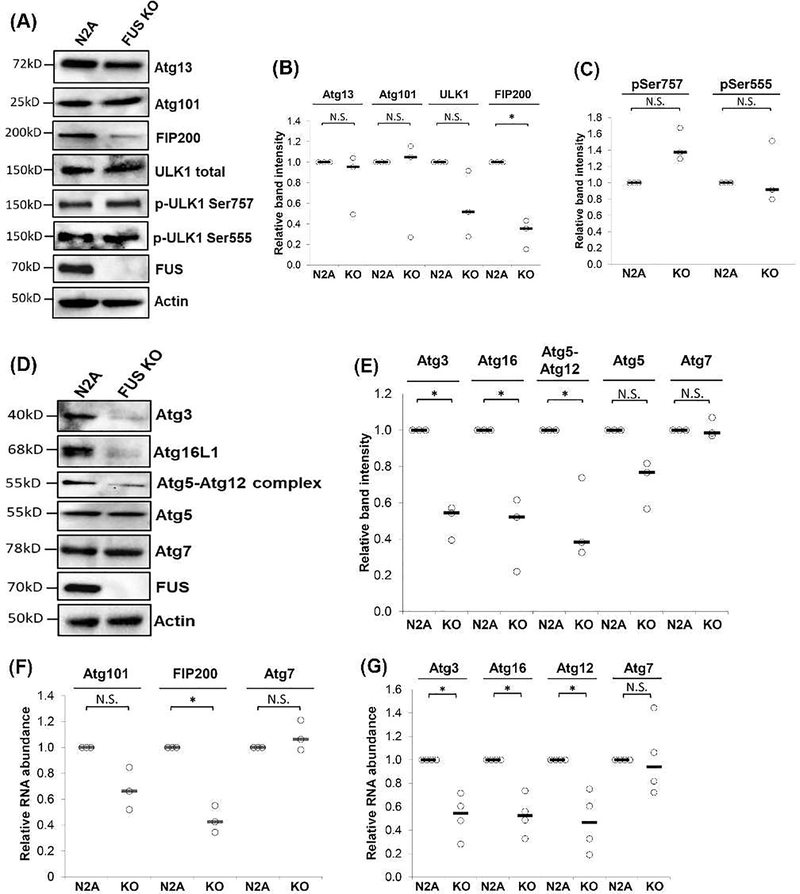
Figure 4. FUS regulated the protein and mRNA levels of proteins involved in early phases of the autophagy pathway.
N2A and FUS KO cells were cultured and immunoblotting was performed using the indicated antibodies. (B-C) Quantification of (A) from three independent t-test was performed for individual comparisons against N2A WT cells. *, p ≤0.05; N.S., not significant. (D) N2A and FUS KO cells were cultured and immunoblotting was performed using the indicated antibodies. (E) Quantification of (D) from three independent t-test was performed for individual comparisons against WT N2A WT cells. *, p ≤0.05; N.S., not significant. (F-G). N2A and FUS KO cells were cultured and harvested for RNA isolation, followed by reverse transcription and quantitative PCR using TaqMan probes for the indicated genes. Actin probe was used to normalize gene expression. Results from three (F) or four (G) independent experiments are shown. Student’s t-test was performed for individual comparisons against N2A WT cells. *, p ≤0.05; N.S., not significant. All quantification results are shown in scatter plots with the bar representing the median.

