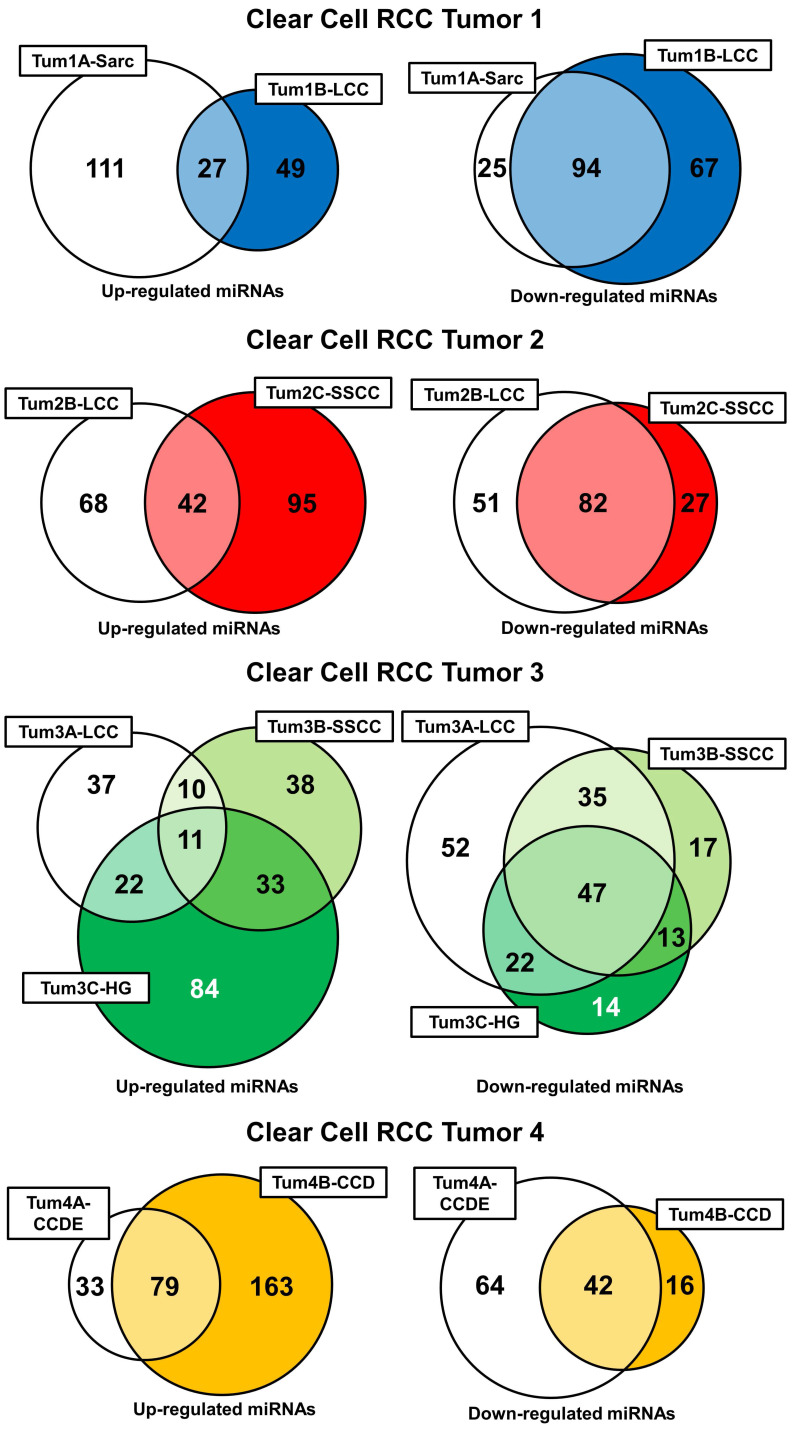
Figure 4.
Intratumoral comparison of miRNA expression profiles. Venn diagrams demonstrate the number of shared and unique up- or down-regulations of miRNAs within each region of each tumor. Each tumor was evaluated individually and colored-coded blue for tumor 1, red for tumor 2, green for tumor 3, and yellow for tumor 4.

