Figure 1.
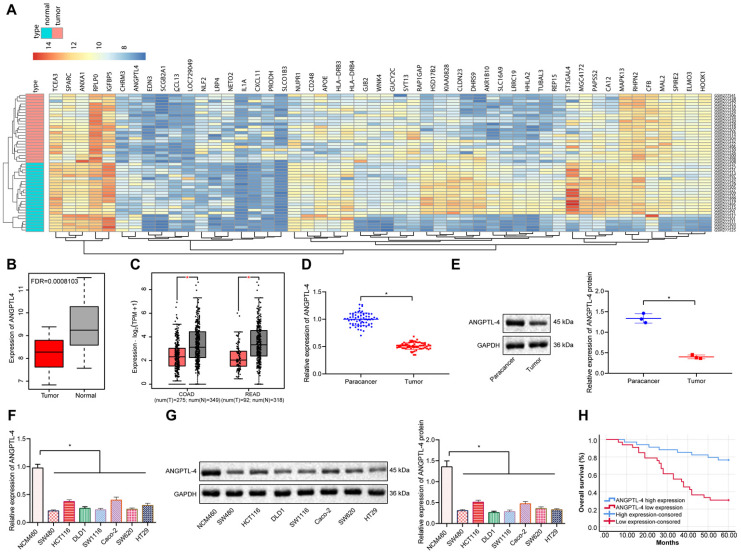
ANGPTL4 expression was reduced in CRC tissues and cells and was associated with poor prognosis of CRC patients. (A) Heatmap depicting partially significant differential gene expression in the CRC-associated gene expression microarray dataset GSE10950; x-axis indicates sample number, y-axis indicates gene name, left dendrogram indicates gene expression level cluster, upper dendrogram indicates sample cluster, each small square indicates the expression of a gene in a sample, and upper right histogram indicates color order (n = 24). (B) Differential gene expression analysis of ANGPTL4 in the GSE10950 microarray dataset; red box plots indicate tumor samples and gray box plots indicate normal samples, and the upper left corner is the corrected differential p-value (n = 24). (C) The expression levels of ANGPTL4 in CRC samples included in the TCGA database; the left side represents colon cancer and the right side represents rectal cancer, the red box plot indicates tumor samples, and the gray box plot indicates the normal samples (n = 24, * p < 0.05 vs. the tumor adjacent tissue). (D) RT-PCR analysis of mRNA expression of ANGPTL4 in CRC tissues (n = 67, * p < 0.05 vs. the para-carcinoma tissues). (E) Western blot analysis of protein levels of ANGPTL4 in CRC tissues, * p < 0.05 vs. the tumor adjacent tissue. (F) RT-qPCR determination of ANGPTL-4 mRNA expression levels in CRC cell lines, * p < 0.05 vs. the NCM460 cells. (G) Western blot analysis of ANGPTL-4 mRNA expression levels in CRC cell lines, * p < 0.05 vs. the NCM460 cells. (H) Survival rate determined by Kaplan-Meier survival curve analysis. All in vitro experiments were performed independently at least three times and the representative data were summarized as mean ± standard deviation. In RT-qPCR and western blot experiments, GAPDH served as the internal reference control. Comparisons were made using Student's t-test. *p < 0.05.

